A pulsar is a spinning neutron star: about one and a half times the Sun’s mass in a ball some 24 km across, with a magnetic field up to a trillion times stronger than Earth’s. A teaspoon of it would weigh about 2 billion tonnes, and the fastest known pulsar turns 716 times a second, about twice as fast as a kitchen blender’s blade. Beams of radiation from near its magnetic poles sweep around the sky as it turns, and if one crosses Earth we see a pulse once per turn. The first pulsar, found by Jocelyn Bell Burnell in 1967, pulsed so regularly that it was nicknamed LGM-1, for “Little Green Men”. This one is calculated live in your browser, following on from our ray-traced black hole.
What you’re looking at
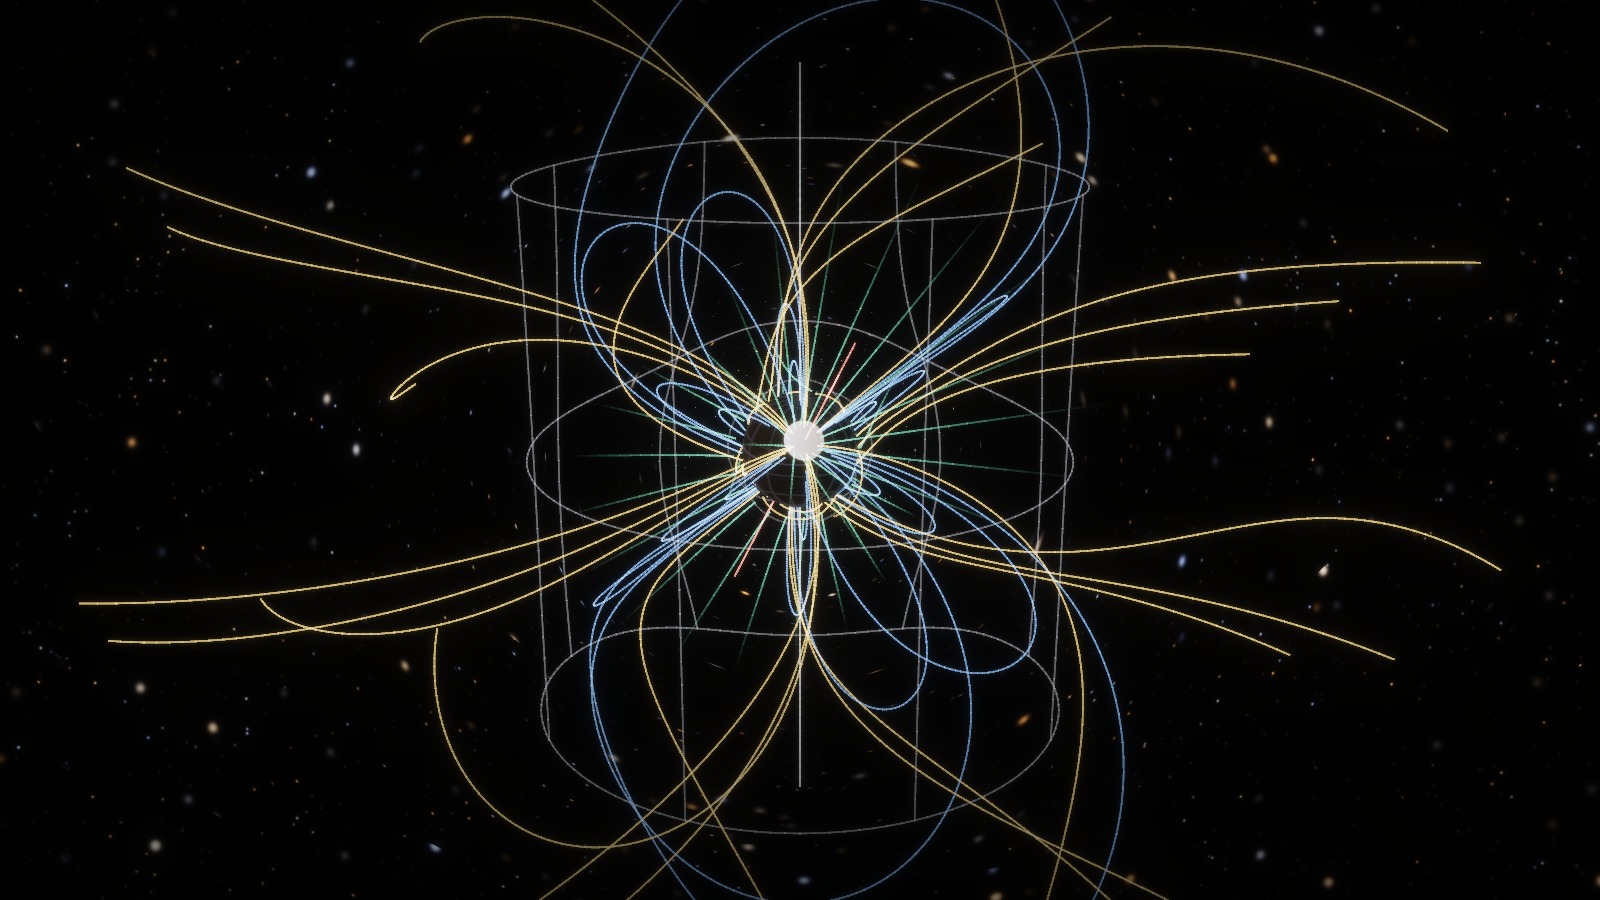
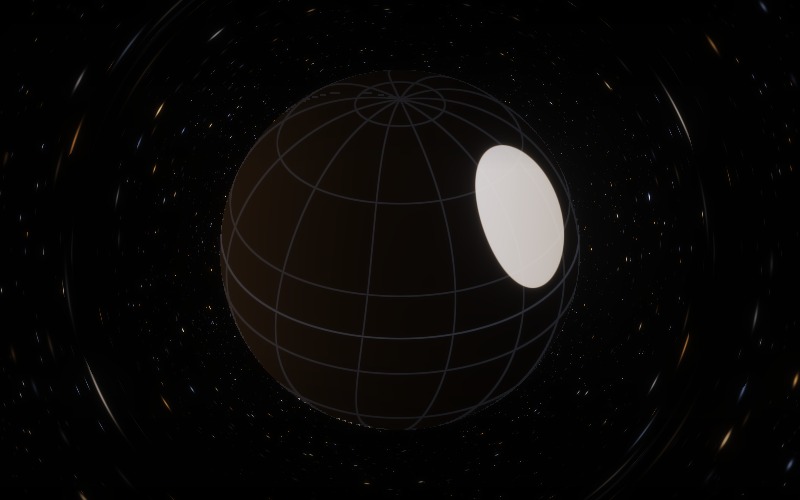
- The star is small and mostly dark. Its two bright spots are where the magnetic poles meet the surface, heated to about a million kelvin by particles striking it from above. At that temperature they glow in X-rays; the simulator scales the temperature into visible light so you can see them.
- The tilted magnetic axis (red) is 60° from the spin axis (white), so the hot spots sit on the star’s sides and are carried around as it spins. That tilt is what makes a pulsar pulse. If the two axes lined up, the beams would point along the spin axis and nothing would change as the star turned. Earth’s magnetic axis is tilted too, by about 10°.
- The blue loops are magnetic field lines that leave one pole and return to the other, like the pattern of iron filings around a bar magnet. They turn with the star.
- The grey cylinder is the light cylinder. Anything turning with the star at that distance from its axis would have to move at the speed of light. For the fastest pulsar it is 67 km out; for the Crab pulsar, 1,590 km.
- The gold lines leave the star near its poles and reach the light cylinder before they can turn back. Beyond it they cannot keep up with the star, so they trail behind it in spirals. The radio beam comes from charges moving out along these lines.
Animation vs. simulation
As with the black hole, nothing here is drawn to look a certain way. Three separate calculations produce the image and the plots beside it:
- The surface is ray traced. For each pixel, the graphics card follows a ray of light back to the star through the curved spacetime around it. The star’s gravity bends light leaving its surface enough that you can see about three quarters of it at once. A hot spot on the far side can still be seen around the edge.
- The field lines come from Maxwell’s equations. For a spinning magnet in empty space there is an exact solution, which shows the lines sweeping back near the light cylinder and carrying energy away. Real pulsars are surrounded by plasma, which changes the field. The simulator includes a plainly labeled approximate version of that case.
- The pulses are what a telescope would record. The X-ray curve adds up light from every visible point of the surface at each moment of the turn. The radio curves follow a beam above the poles, including its polarization: the direction in which its waves vibrate.
A lighthouse, but not quite
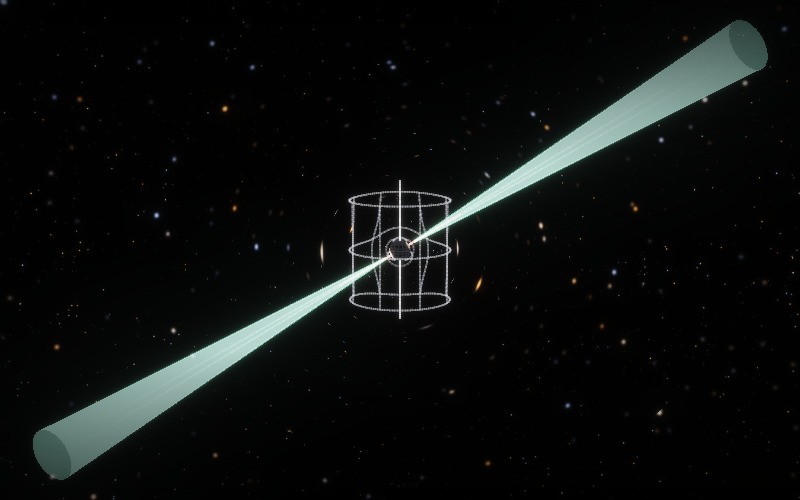
Most people picture a pulsar the way textbooks and science videos draw it: a star with two narrow searchlight beams sweeping around like a lighthouse. The simulator can draw that picture too, for comparison:
Here is where the light of a pulsar’s beam actually is at one instant, computed for the same star at the same scale:
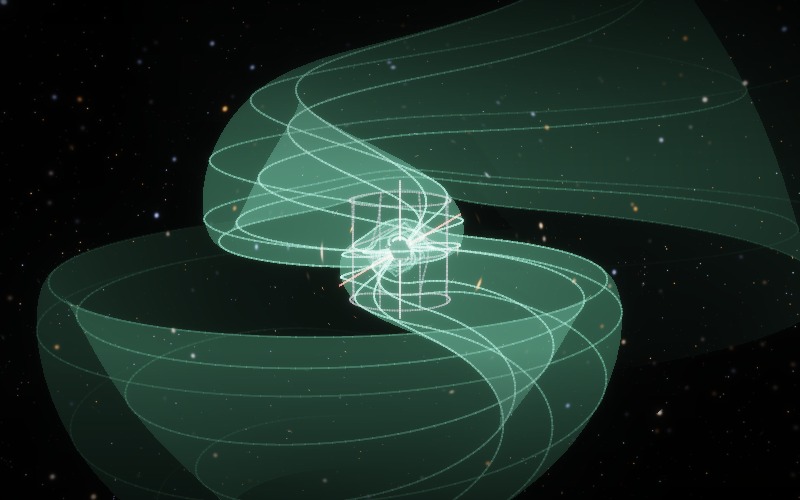
- The beam curves, because light takes time to travel. The textbook beams reach about 530 km from the star. Turning with it, their far ends would move at up to 8 times the speed of light. What actually happens is that each photon flies straight out from where it was emitted, while the beam’s direction keeps sweeping on. At any instant, the light already emitted lies along a spiral, like water from a spinning lawn sprinkler, with one turn every 420 km for the fastest pulsar.
- You can’t see a beam from the side. Searchlights on Earth are visible because fog and dust scatter their light toward you. Space around a pulsar has almost nothing to do that, so a beam is only seen when it points at you, as a pulse. Both images draw the beam as if it glowed.
- Real beams are wider and less tidy. The computed beam for this pulsar is tens of degrees wide. It comes from just above the surface and is tilted forward by the star’s rotation. Real beams range from a few degrees to a few tens of degrees across and are often hollow. A pulsar’s gamma rays come from somewhere else again: farther out, near the light cylinder.
- X-ray pulses aren’t beams. The hot spots glow in nearly every direction. Their pulses come from the spots turning in and out of view, smoothed by light bending.
Is this to scale? Yes: the 12 km star, the 67 km light cylinder and the 420 km spiral are all drawn at true size. The spiral’s spacing is always 2π light-cylinder radii, because both depend only on the spin period. Only the fastest pulsars put the star and the spiral in the same picture. For the Crab pulsar one turn of the spiral is 10,000 km, and for a pulsar spinning once a second it is 300,000 km. At that scale the star would be far too small to see.
The “Beam light in flight” view shows the spiral forming. It spins faster than the other views so you can watch it being laid down.
Measuring a star you cannot see
No telescope can resolve a neutron star’s surface. What NASA’s NICER X-ray telescope records is how the brightness rises and falls as the hot spots rotate in and out of view. The more compact the star, the more its gravity bends light around it and the less its brightness varies. The faster its surface moves, the more lopsided the pulse becomes. Fitting both effects lets astronomers work out a star’s mass and radius separately. For the pulsar PSR J0437−4715 they find 1.42 suns and 11.4 km.
The simulator computes the same kind of curve, without the detailed atmosphere models and fitting a real analysis needs. Switch light bending off and the pulse becomes much deeper: in one example the brightness swings 78% either side of its mean instead of 38%.
Comparing against known results
- An independent check. A separate Python program computes the same light paths a different way. The two agree to a few millionths of a radian.
- Two ways to get each pulse. The X-ray curve is computed once by adding up the surface and once by tracing 360,000 individual rays. The two agree to 0.15%.
- A 1991 prediction. Theory says the polarization of the radio pulse should lag behind the pulse itself by an amount set by how high above the star the radio waves are made. The simulated beam shows that lag to within 13% of the prediction.
- Stated limits. The page lists what the model leaves out, including the star’s flattening from fast spin, gravity’s effect on the magnetic field, and the unsolved question of how pulsars make radio waves at all.
Where to view it
Like the black hole, it runs on your device’s graphics card and works best on a laptop or desktop. You can pick a real pulsar from the list, including three that NICER has measured, the Crab and Vela pulsars, and a magnetar, or set the mass, size, spin and magnetic tilt yourself. Preset views include the beam as a cone or as light in flight, and a pulsar with aligned axes, which doesn’t pulse at all.
Built with Claude Opus 5.5
I built this with Claude Opus 5.5: the physics design, the GPU code, the test programs that check it, and the write-up. Every image and curve on the page comes from the simulator itself, and the method page lists the equations, the tests and the papers behind them.
The images are free to use, for teaching or anything else, with credit. Try it here.