In 2006, astronomers announced a planet about five times the mass of Earth, orbiting a faint star 21,500 light-years away. Nobody has seen the planet, and nobody had seen its star. For about a day in August 2005, the planet's gravity bent the light of a different, more distant star, and that was enough. This simulator calculates how, live in your browser, using the parameters published for that event and several others. It follows our black hole, pulsar and light-speed simulations, and like them it is calculated, not drawn.
What you’re looking at
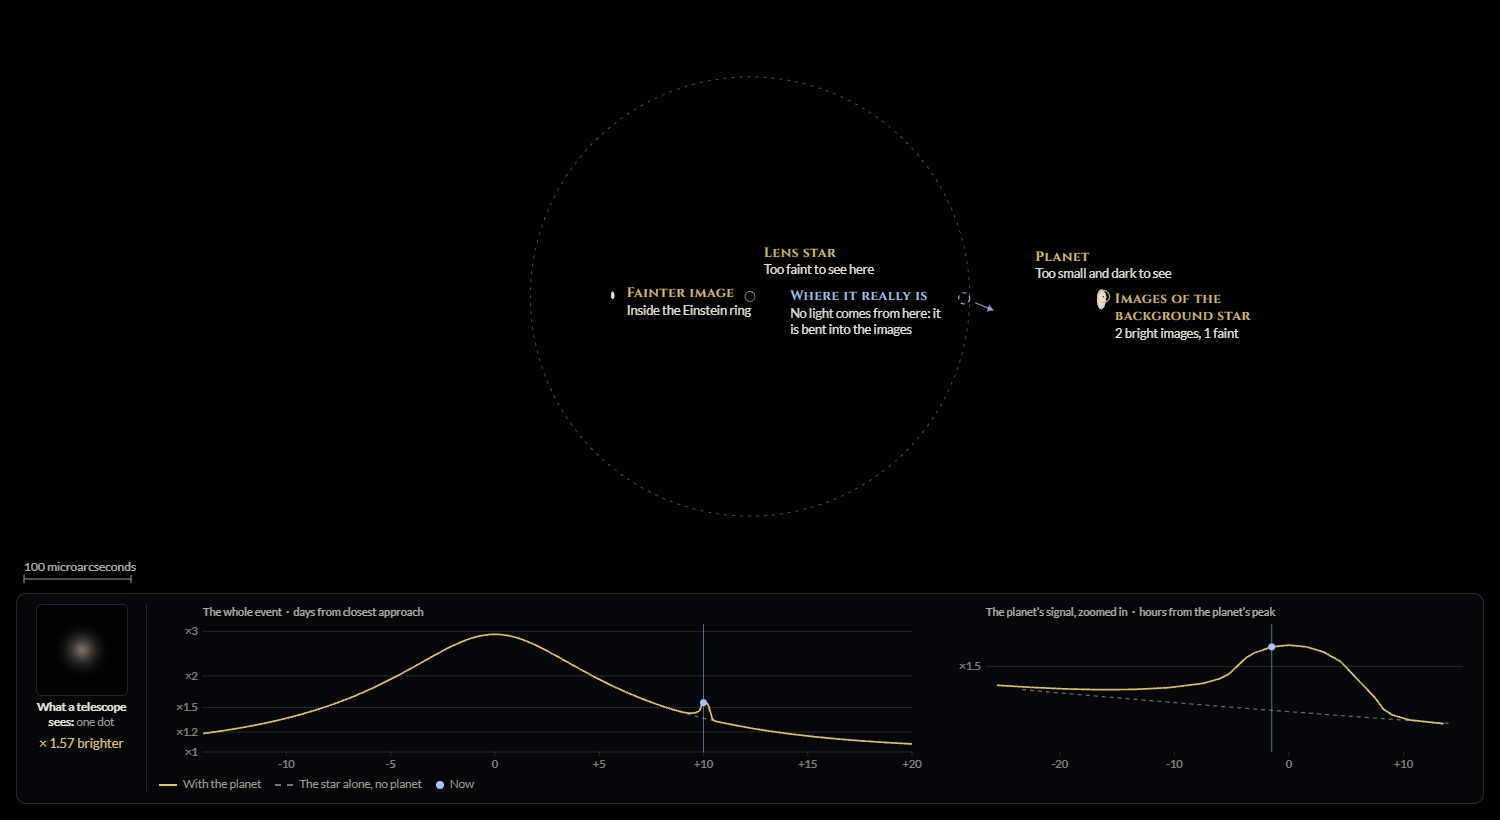
- Two stars almost in line. A faint star in our galaxy (the lens) passes almost exactly in front of a more distant star (the background star). Gravity bends the background star's light around the lens star, so it reaches us along two paths, and we would see two images of it, one on each side of the lens.
- The dashed gold circle is the Einstein ring: where the image of a star exactly behind the lens would form. Its size is set by the lens star's mass and the distances. The images swing around near it as the background star moves past.
- The dashed blue circle shows where the background star really is. All of its light that reaches us has been bent into the images.
- The light curve at the bottom is what astronomers actually record: how many times brighter the background star looks, day by day. Together the images cover more area than the star, and every part of them is exactly as bright as the star's surface, so together they bring more light. The star brightens for a few weeks and fades again.
- The planet is a small marked circle. It is far too small and dark to see. When one of the images passes close to it, its gravity distorts that image, and the light curve shows a short extra bump.
- The telescope dot beside the light curve is what a real telescope sees. The two images are about a thousandth of an arcsecond apart, the size of a person standing on the Moon, and our atmosphere blurs every star into a smudge hundreds of times larger. So the whole event is one dot getting brighter and fainter.
The surprise: two lenses or one?
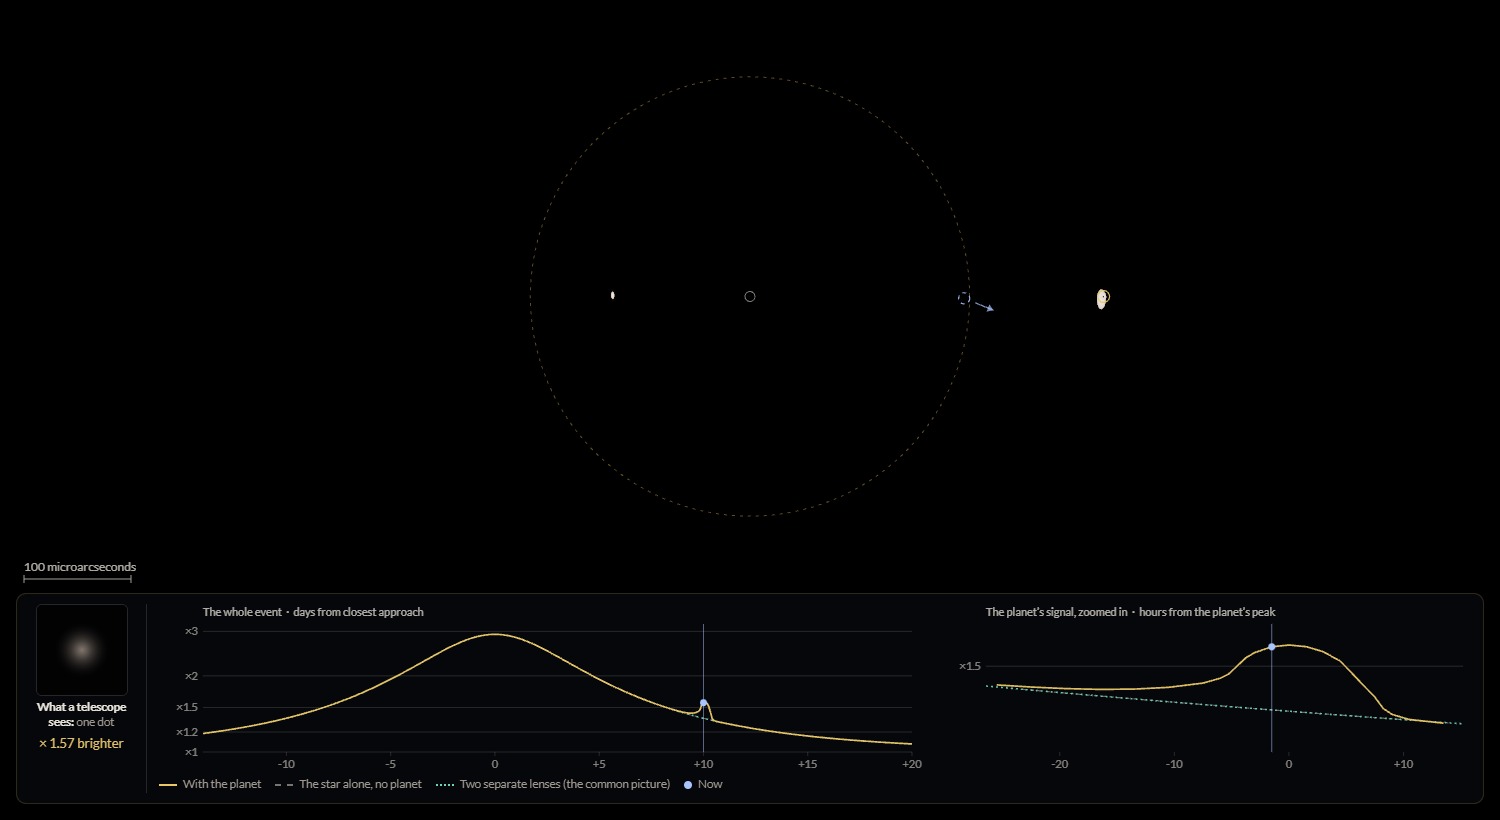
While working on this, I was surprised to learn how a planet's signal really works. The natural picture, and one you'll find in many diagrams, is two separate lenses: the star passes in front of the background star and brightens it, and the planet does the same later, adding a little bump of its own. For that, the planet would have to pass almost exactly in front of the background star.
For most planets found this way, that isn't what happens. The planet doesn't need to pass in front of the background star; it needs to sit on one of the star's images. The host star has already stretched the background star's light into arcs near the Einstein ring, and a planet near those arcs disturbs them. In OGLE-2005-BLG-390, the two-separate-lenses picture predicts no planet signal at all: the background star never passed near the planet itself. The real calculation gives the bump that was seen.
A planet can even take light away. A planet inside the Einstein ring sits near the fainter image and can shrink it, so the star looks dimmer than it would without the planet. In OGLE-2016-BLG-1067, a planet about half Jupiter's mass cut the brightness by up to 21% for two to three days.
More things the calculation shows
- Bigger, not brighter. Like any lens, gravity can't make a surface brighter. The image of the star is larger, and each part of it is exactly as bright as the star's surface; a bigger image at the same brightness sends more light. Unlike a glass lens, gravity bends light more the closer it passes, so there is no single focus.
- Infinite in principle. When the background star crosses a caustic, a line behind the lens where two new images appear, a point-like star would become infinitely bright. Only the star's real size limits the spike, and the spike's width is how astronomers measure that size.
- A complete ring. In OGLE-2004-BLG-254 the lens passed almost through the middle of a giant star's disk, and the image became an almost complete Einstein ring, 54 times brighter than the star. Its slightly darker edges show the star's limb darkening.
- Our own solar system. If the Sun were the lens, halfway to the centre of the galaxy, its Einstein ring would have a radius 4 times the Earth–Sun distance, not far inside Jupiter's orbit. Jupiter could leave a strong signal. Earth, much closer to the Sun, would change the brightness by less than a thousandth of a percent.
- A planet with no star. OGLE-2016-BLG-1928 was probably a rogue planet, with no star nearby, about a third of Earth's mass. Its Einstein ring is three times smaller than the star behind it, and the event lasted only about six hours.
“No great chance”
In 1936 a Czech engineer and amateur scientist, Rudi Mandl, persuaded Einstein to publish a short calculation of one star acting as a lens for another. Einstein concluded that "there is no great chance of observing this phenomenon", and privately called the paper "of little value". Fifty years later Bohdan Paczyński pointed out that if you watch millions of stars, about one in a million is being lensed at any moment. In 1991 Paczyński and Shude Mao showed the method could find planets, and in 1992 Andrew Gould and Avi Loeb showed that a system like ours would show up in about one event in five. The first events were seen in 1993 and the first planet in 2003. About 290 planets have now been found this way, and NASA's Roman Space Telescope, launched on 30 August 2026, is expected to find more than a thousand more.
How astronomers measure it
The shape of the light curve gives the geometry: how close the background star passed, the planet's mass as a fraction of its star's, and its distance from the star in Einstein radii. The mass and distance of the lens itself need more: the event seen from two places, or a sharp image of the lens star years later. Hubble did that for the first planet less than two years after the event. Many published masses are still estimates, and the page says which.
Animation vs. simulation
An animation is drawn to look right. Here nothing is drawn: for every pixel, the graphics card follows the light back through the lens equation of general relativity to the background star, and the light curve adds up the images exactly. The planet's bump comes out of the equations, at the time the astronomers reported it, because each real event uses their published parameters.
Comparing against known results
A separate Python program, written independently, works the same problems a different way: the images at 40-digit precision, and the brightening of a finite star by brute-force ray tracing. The simulator agrees with it to about one part in ten thousand or better, and it reproduces the published times of the planets' signals: the bump in OGLE-2005-BLG-390 about ten days after the peak, and the caustic crossings of OGLE-2003-BLG-235 about 13 and 6 days before it.
Where to view it
It runs on your device's graphics card and works best on a laptop or desktop. It opens on OGLE-2005-BLG-390. Then try “Two lenses or one?”, “Bigger, not brighter” and the map behind the lens, and the other real events: the first planet found this way, the planet that takes light away, the star passing right behind another, the rogue planet, and our own Sun with Jupiter or Earth.
Built with Claude Opus 5.5
I built this with Claude Opus 5.5: the physics design, the GPU code, the test programs that check it, and the write-up. Every image comes from the simulator itself, and the method section gives the equations, the tests and the papers behind each event.
I’m sure I’ve gotten some details wrong, so corrections are welcome. The images are free to use, for teaching or anything else, with credit. Try it here.