The Idea in One Picture
One Star, Two Images, One Planet
Every image on this page is calculated by the simulator from the equations of general relativity, using the parameters published by the astronomers who observed each event (or, for our own solar system, its known masses and orbits). The light curves are checked against an independent calculation, and the light in each picture against the light curves. Nothing is drawn by hand.
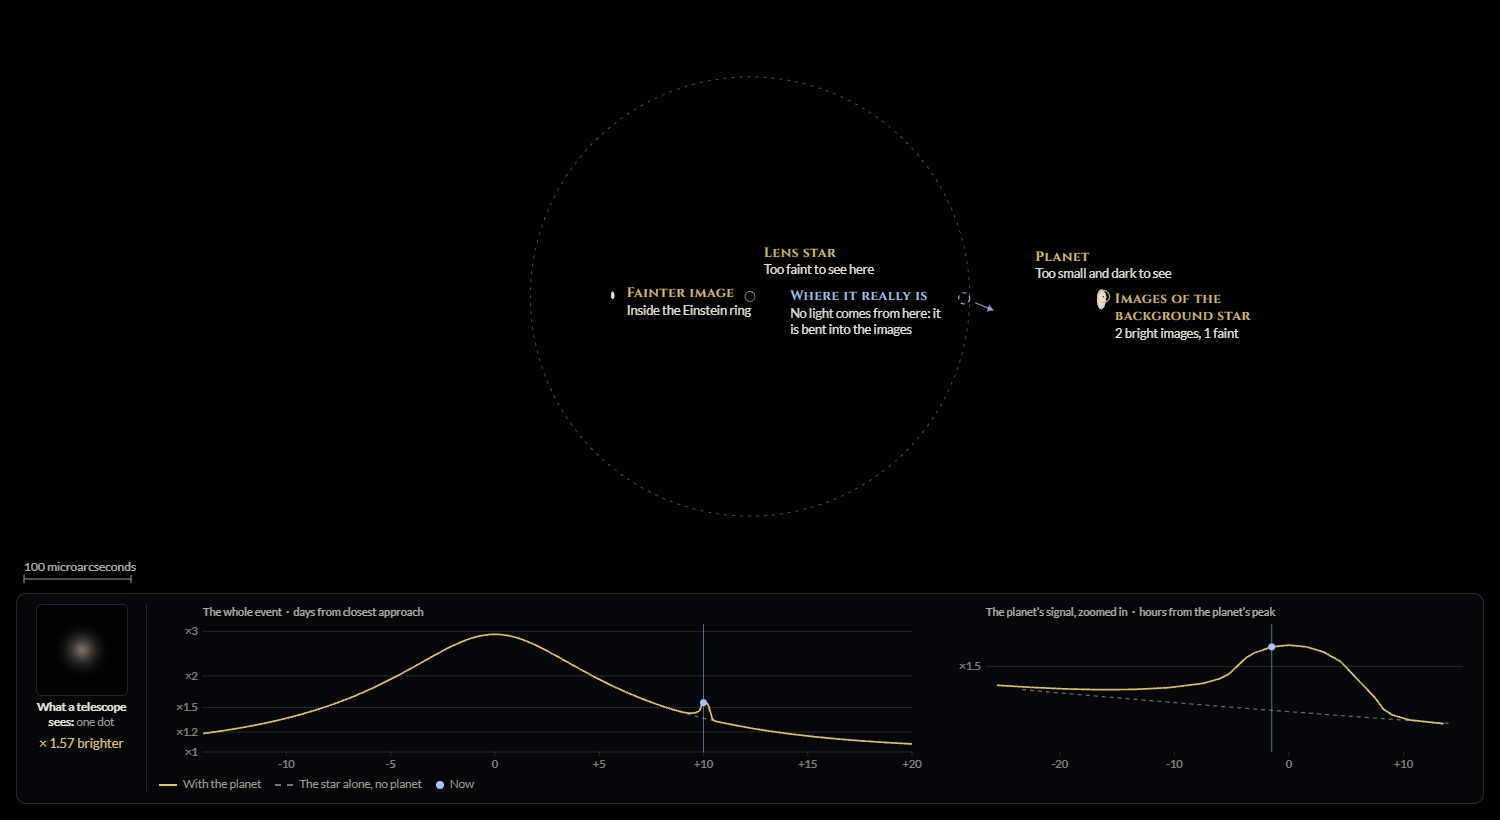
The light splits
Gravity bends light. When a star in our galaxy passes almost exactly in front of a more distant star, light from the distant star can reach us along two paths, one on each side of the nearer star. So we would see two images of the distant star, both stretched into short arcs around a circle called the Einstein ring.
The star brightens
Together the images cover more area than the star itself: the brighter one is larger than the star, the fainter one smaller. Every part of them is exactly as bright as the star's surface, so more area means more light, so the distant star seems to brighten for a few weeks and then fade back. In OGLE-2005-BLG-390 it became 2.9 times brighter.
A planet distorts one image
If the nearer star has a planet, and one of the images passes close to it, the planet's own gravity distorts that image and the brightness changes for a few hours or days. That short blip is how the planet is found. No ordinary telescope can separate the images; what astronomers record is the change in brightness.
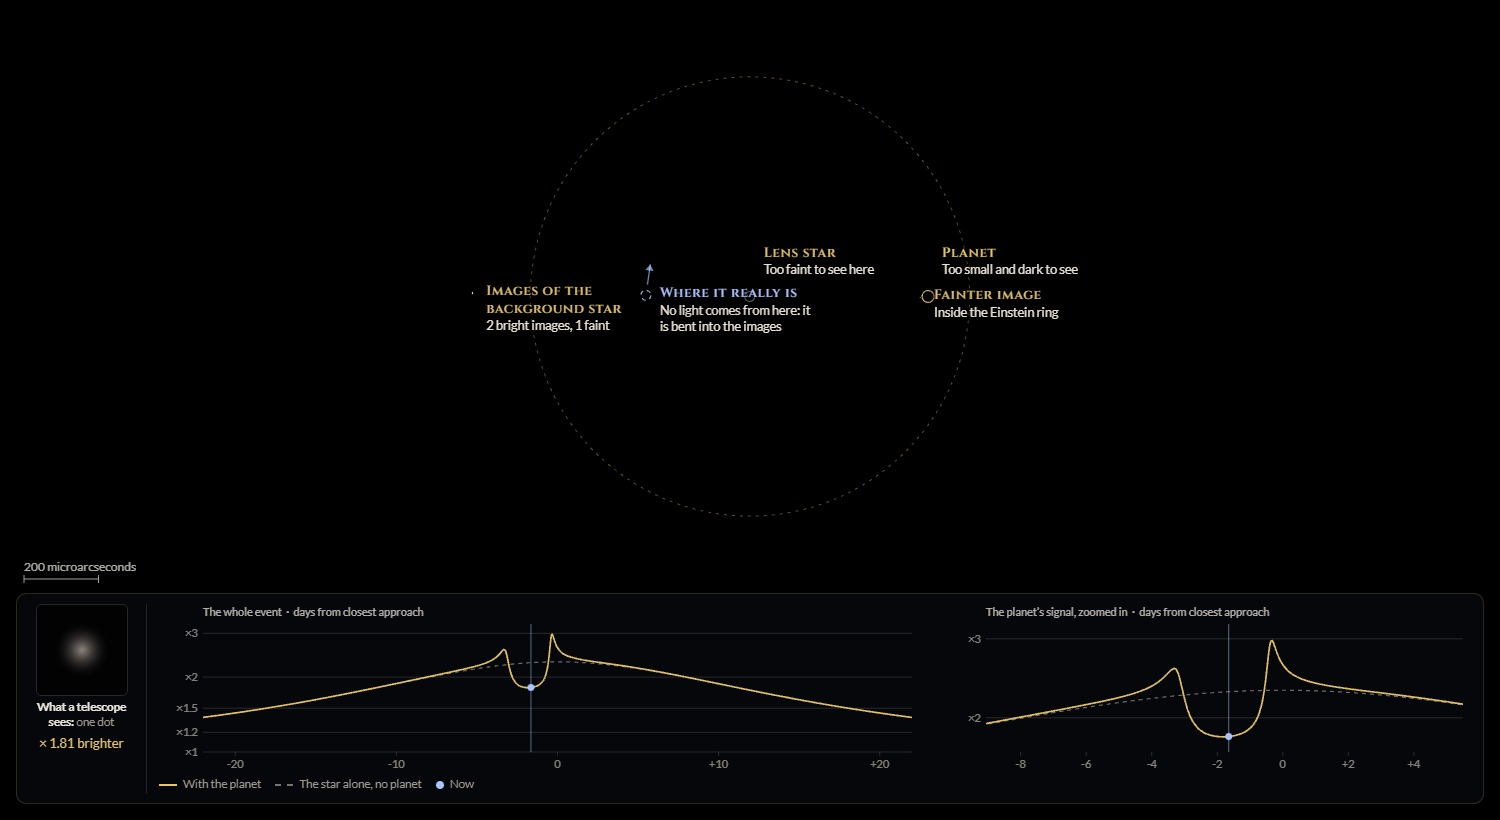
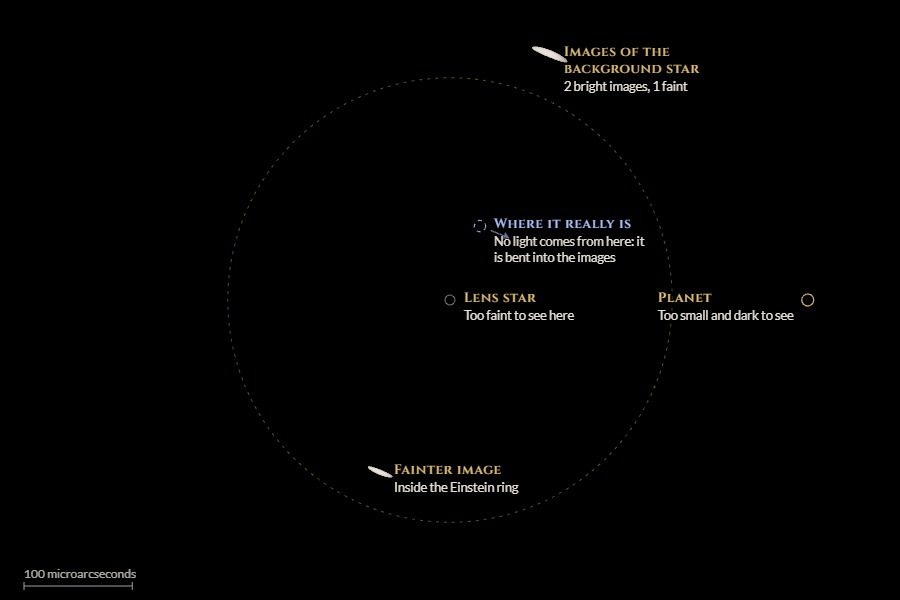 At the peak: two images, on either side of the lens star
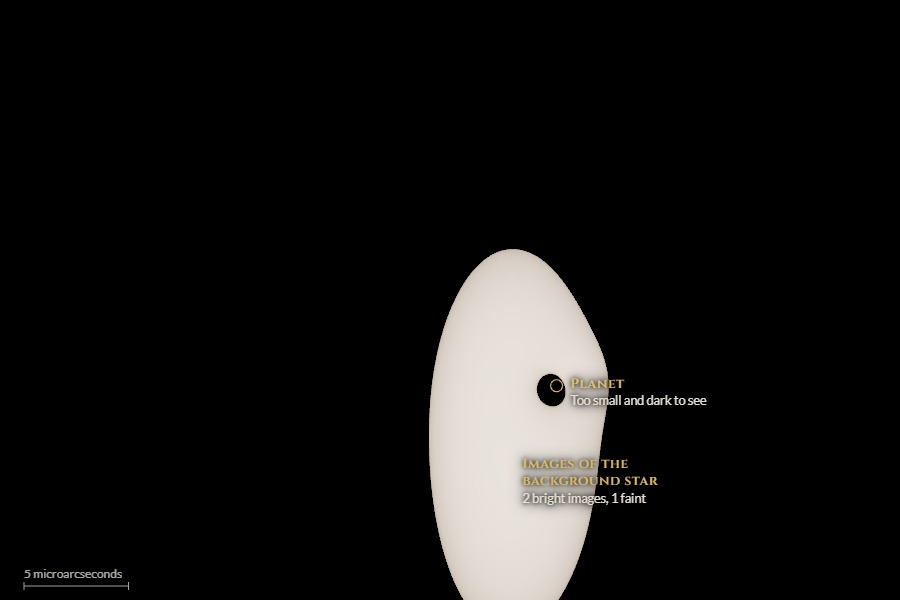 Ten days later, zoomed in on the image passing the planet
About This Page
A Simulation, Not an Animation
Try this first. In 2006, astronomers announced a planet about five times the mass of Earth, orbiting a dim star 21,500 light-years away, far too faint for any telescope to show the planet itself. How could they know it was there?
Not by seeing it, and not by its pull on its star. For about a day, its gravity bent the light of a different, more distant star.
The simulator shows a patch of sky about a thousandth of an arcsecond across, enlarged about a hundred million times so that you can see what no ordinary telescope can: the images of the background star, the lens star and its planet. A dashed blue circle marks where the background star really is, behind the lens, and the gold dashed circle is the Einstein ring. Below is the light curve, which is what astronomers actually record, beside a dot showing what a telescope sees. You can choose real events, switch the planet's gravity off, compare with the common picture of two separate lenses, look behind the lens at a map of where the brightening happens, or build your own event. Hold the pointer over any view, setting or number for a short explanation.
Calculated, not drawn. For each pixel, your graphics card follows the light back past the lens star and its planet to the background star, using the lens equation of general relativity, and gives it the brightness of the star's surface at that point. The light curve adds up all the images of the star's disk exactly: the positions of the images come from solving a fifth-degree polynomial, and the light of a disk with darker edges is added up around its outline. The results agree with an independent calculation to about one part in ten thousand or better (see Verification below). Each real event uses the parameters published by the team that discovered it. It runs best on a laptop or desktop. Built with Claude Opus 5.5, which did the physics design, the GPU code, the test programs and this write-up.
What You're Seeing
Reading the Image
The scale
For OGLE-2005-BLG-390, the picture is about a thousandth of an arcsecond across. A thousandth of an arcsecond is how large a person standing on the Moon would look from Earth. The scale bar in the corner shows the size in microarcseconds, millionths of an arcsecond.
The Einstein ring
The dashed gold circle is where the image of a star exactly behind the lens would form: a complete ring. Its size depends on the lens star's mass and the two distances, and it sets the scale of everything else. For a star like the Sun halfway to the centre of our galaxy, the ring's radius at the lens is 4 times the Earth–Sun distance, most of the way out to Jupiter's orbit.
Two images
The background star appears twice: a brighter image outside the ring, on the same side as the star really is, and a fainter one inside it, on the opposite side. As the star moves past, the images swing around the ring. When the alignment is almost perfect they stretch into arcs and nearly close into the ring.
Where it really is
The dashed blue circle is the background star's true position, with an arrow for the way it is moving. You can't see the star there: all of its light that reaches you has been bent into the images.
The lens star and its planet
Both are marked with small circles. The lens star is drawn at its true size and brightness, which usually makes it invisible at this scale: typical lens stars are faint red dwarfs. The planet is far too small and dark to show; it is found only through its gravity.
Five images
With a planet there are three images: the two described above and a very faint one close to the planet. When the background star crosses a line called a caustic (shown in the map view), a fourth and fifth appear as a pair, and the brightness jumps sharply.
The light curve
The graph at the bottom shows how many times brighter the background star appears, against time in days. The gold line includes the planet; the dashed line is the star alone. When the planet's signal is short, a second panel zooms in on it. The playback slows down when the brightness changes quickly, so the planet's moment can be watched.
A shifted dot
Because the images are uneven, the centre of the light shifts slightly away from the star's true position, shown under Event as "Light centre shifted by". It is a few tens of microarcseconds, far too small for ordinary telescopes, but Hubble has measured this shift for an event caused by a lone black hole (Sahu et al. 2022).
In Everyday Terms
Why Telescopes See One Dot
The workings for each number are in the notes under References.
At a Glance
OGLE-2005-BLG-390 in Numbers
What the Calculation Shows
Two Lenses or One?
While working on this, I was surprised to learn how a planet's signal really works. A natural picture, and one you'll find in many diagrams, is that the star and its planet act as two separate lenses: first the star passes in front of the background star and brightens it, and later the planet does the same, adding a small bump of its own. In that picture the planet has to pass almost exactly in front of the background star.
For most planets found this way, that isn't what happens. The planet doesn't need to pass in front of the background star; it needs to sit on one of the star's images. The host star has already split the background star's light and stretched it into arcs near the Einstein ring, and a planet anywhere near those arcs disturbs them. That is why planets close to the Einstein ring are the ones that get found. Chang and Refsdal described the same effect in 1979 for single stars near the light path of a quasar whose image a galaxy had already split, and Mao and Paczyński and Gould and Loeb worked it out for planets in 1991 and 1992.
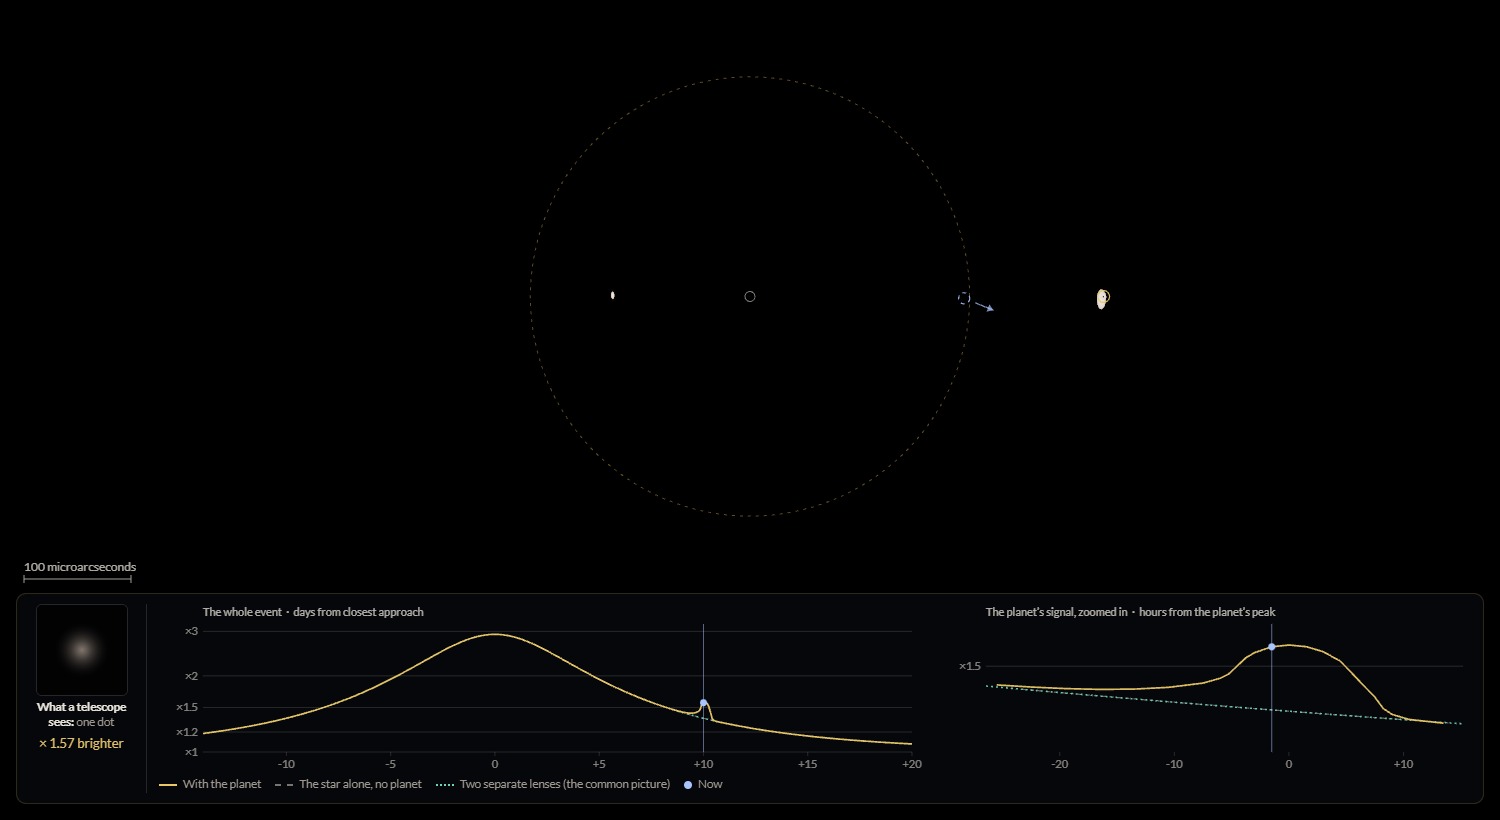
A planet can take light away. A planet inside the Einstein ring sits near the fainter image, the one inside the ring, and its gravity can shrink that image. The star then looks dimmer than it would without the planet. It is not dimmer than normal, since the event is still brightening it, but dimmer than the star alone would make it. In OGLE-2016-BLG-1067, a planet about half the mass of Jupiter cut the brightness by up to 21% for two to three days.
When the common picture is right. For a planet far from its star, several Einstein radii out, the two effects really do separate, and the planet acts as its own small lens. The same is true for a planet with no star at all, like the rogue-planet candidate in the event list.
How It's Measured
From One Dot to a Planet
A survey telescope records the brightness of one dot, as often as every 15 minutes, for months. When a dot starts to brighten in the smooth, symmetric way of a lens, observers around the world watch it more often, hoping to catch a planet's signal. The shape of the light curve then gives the geometry: how close the background star passed, how long it took, the planet's mass as a fraction of its star's, and its distance from the star in Einstein radii.
If the background star crosses a caustic, or brushes one as in OGLE-2005-BLG-390, the sharpness of the change tells how large the star is compared with the Einstein ring. The star's true size on the sky follows from its colour and brightness, and together they give the size of the Einstein ring. That still leaves the mass and the distance of the lens tangled together. Untangling them needs something more: the slight difference in the event seen from two places (Earth and a spacecraft, or Earth at two points in its orbit), or a sharp picture of the lens star years later, once it has moved away from the background star. Hubble did this for the first planet found this way, less than two years after the event, and the Keck telescope in 2025 for OGLE-2016-BLG-1195, a planet of about 10 Earth masses. Many published planet masses, including the 5.5 Earth masses of OGLE-2005-BLG-390, are still statistical estimates.
The images themselves have now been seen. In 2019, astronomers using the GRAVITY instrument, which combines telescopes of the Very Large Telescope in Chile, reported the first resolved images of a microlensing event, an unusually bright one. Hubble has measured the shift of the centre of light caused by an isolated black hole. And on 30 August 2026, NASA launched the Nancy Grace Roman Space Telescope, which will watch the centre of our galaxy from space and is expected to find more than a thousand planets this way.
Controlled Experiments
Switch Off the Physics, One Effect at a Time
Each comparison changes one thing, so you can see what each piece of physics does. Every image was rendered by the simulator, and you can recreate them all with the settings named in the captions.
The background star's size
OGLE-2003-BLG-235, the first planet found by microlensing. The background star entered the caustic 12.8 days before its closest approach to the lens and left it 6.0 days before, matching the days the discovery team reported. With the star's real size (left), the brightest moment reaches 13 times its normal brightness. Treated as a point (right), the star would become infinitely bright at each crossing; our sampled curve reaches 1,600 times. The star's real size limits the spikes, and their width is how astronomers measure the star's size compared with the ring.
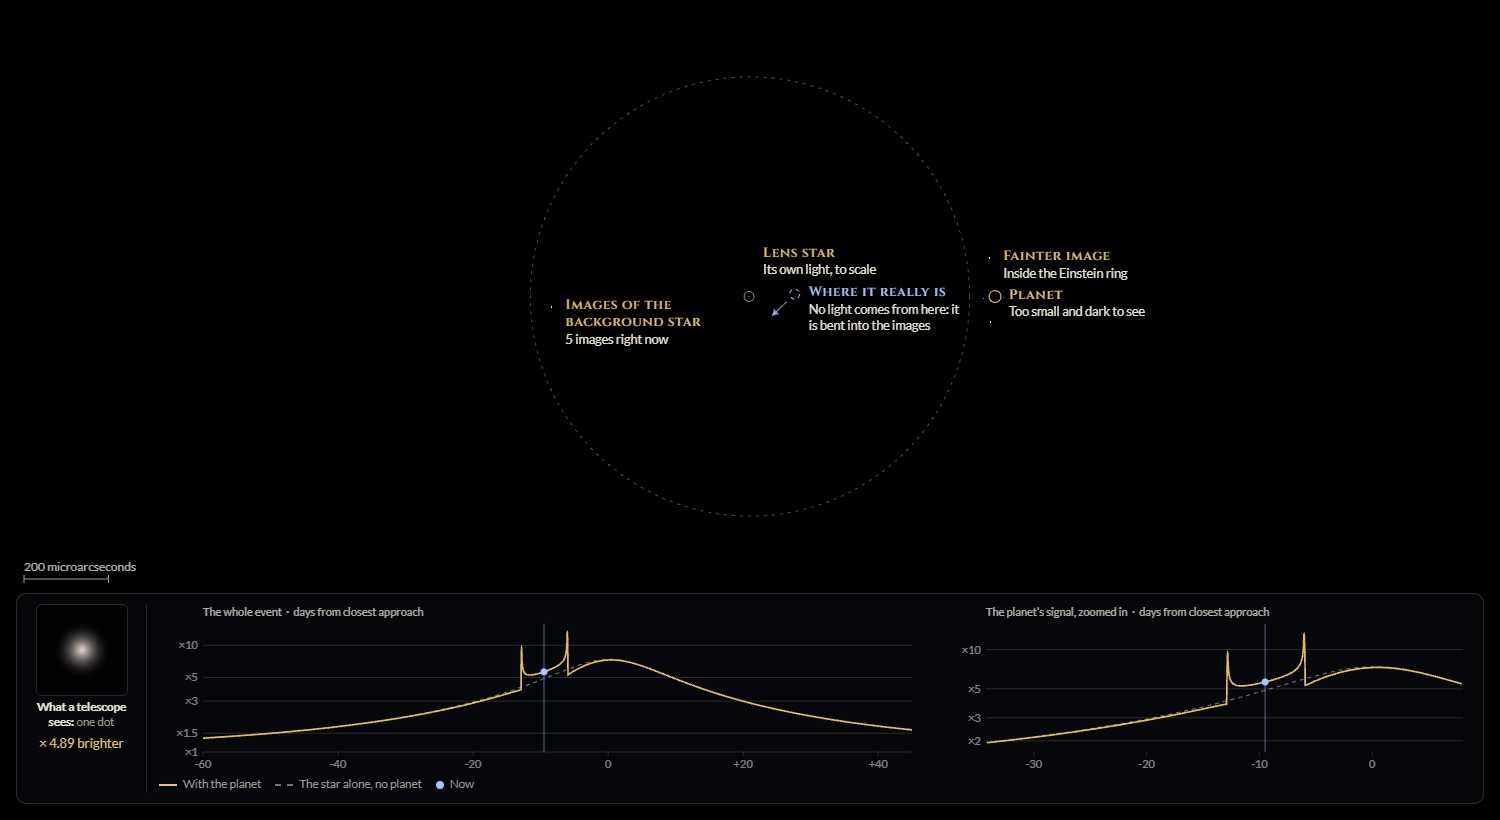 Real size: peaks of about ×13
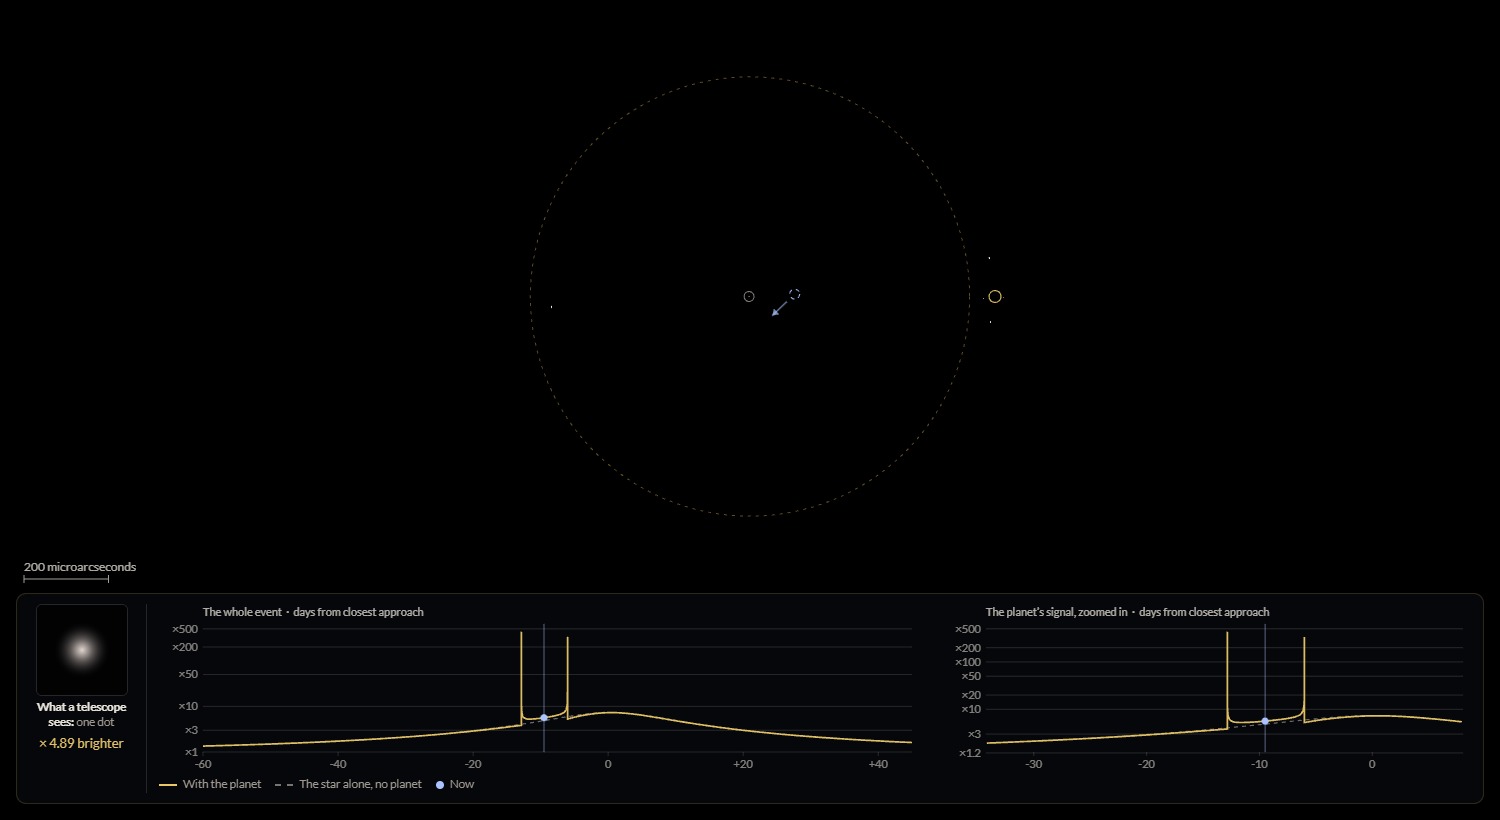 "Background star's real size" off: spikes without limit
Darker edges
OGLE-2004-BLG-254: a lens star passing almost through the centre of a giant star's disk, which turns the image into a complete Einstein ring, a thin band all the way around the lens. Stars look darker near their edges, because we see less deeply into them there. With that limb darkening, the peak is 53.6 times the normal brightness; with an evenly bright disk it would be 49.8. In the ring, it shows as darker inner and outer edges. Measuring it is one of the few ways to study the surface of a star this far away.
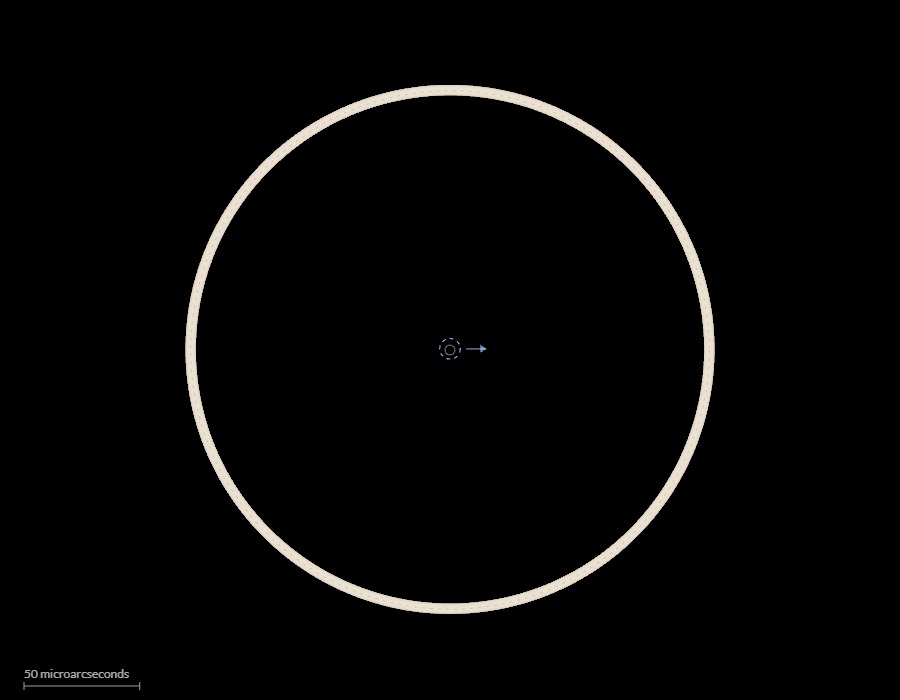
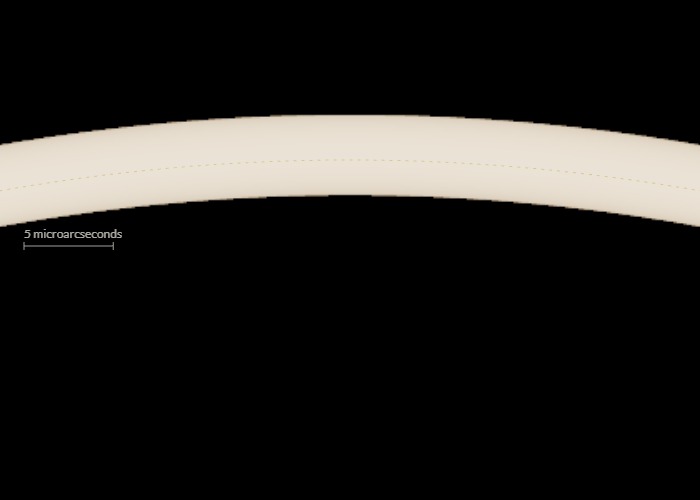 With limb darkening (as observed)
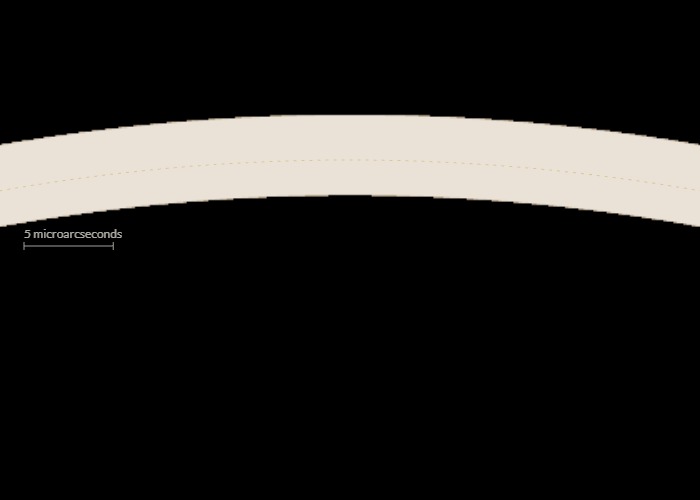 "Darker edge" off: an evenly bright disk
Bigger, not brighter
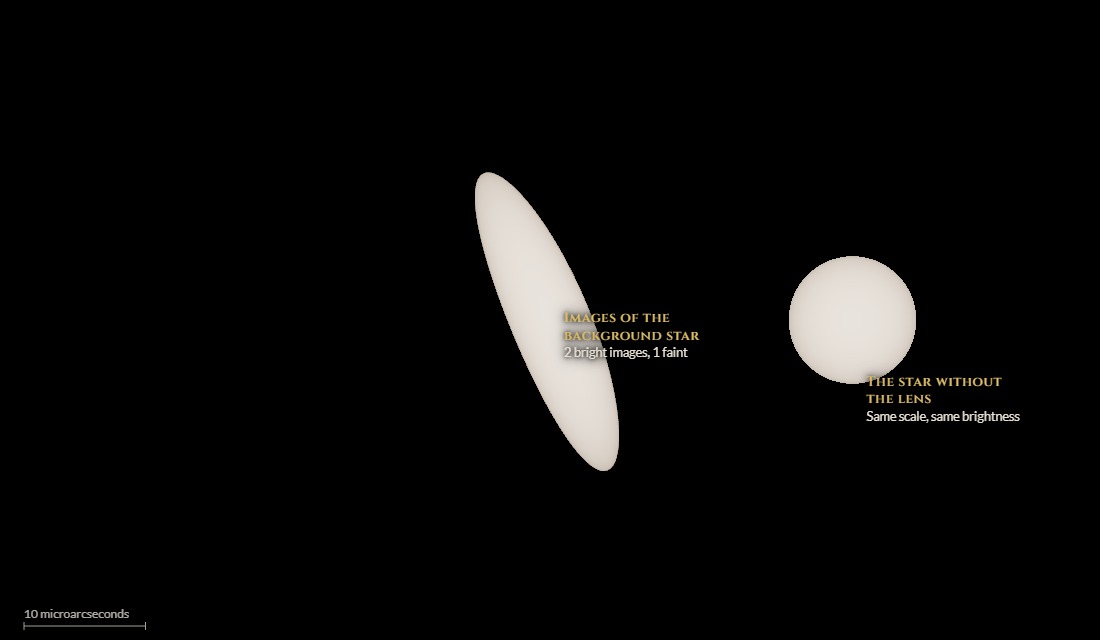
Like any lens, gravity can't make a surface brighter. It makes the image of the star bigger, each part of the image keeps exactly the brightness of the star's surface, and a bigger image at the same brightness sends us more light. A magnifying glass works the same way; the difference is that gravity bends light more the closer it passes to the lens, so there is no single focus. Here the image of OGLE-2005-BLG-390's background star (left) is shown beside the star as it would look without the lens (right), at the same scale and brightness.
Behind the lens
The map view shows the plane of the background star. Brighter blue means a point there would be magnified more, and the gold lines are the caustics. For OGLE-2005-BLG-390 the planet's caustic is a small diamond 0.99 Einstein radii from the star. The background star (the translucent disk) was about three times as wide as the diamond. Its centre missed the diamond, but its disk passed over it, and that made the bump.
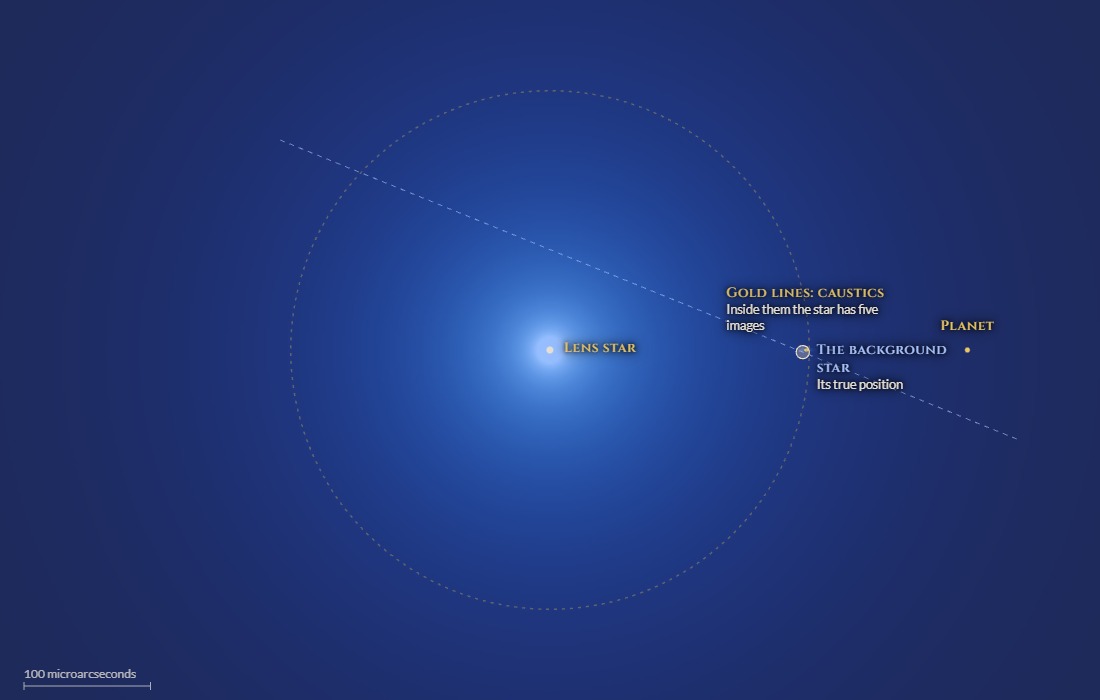 The whole event
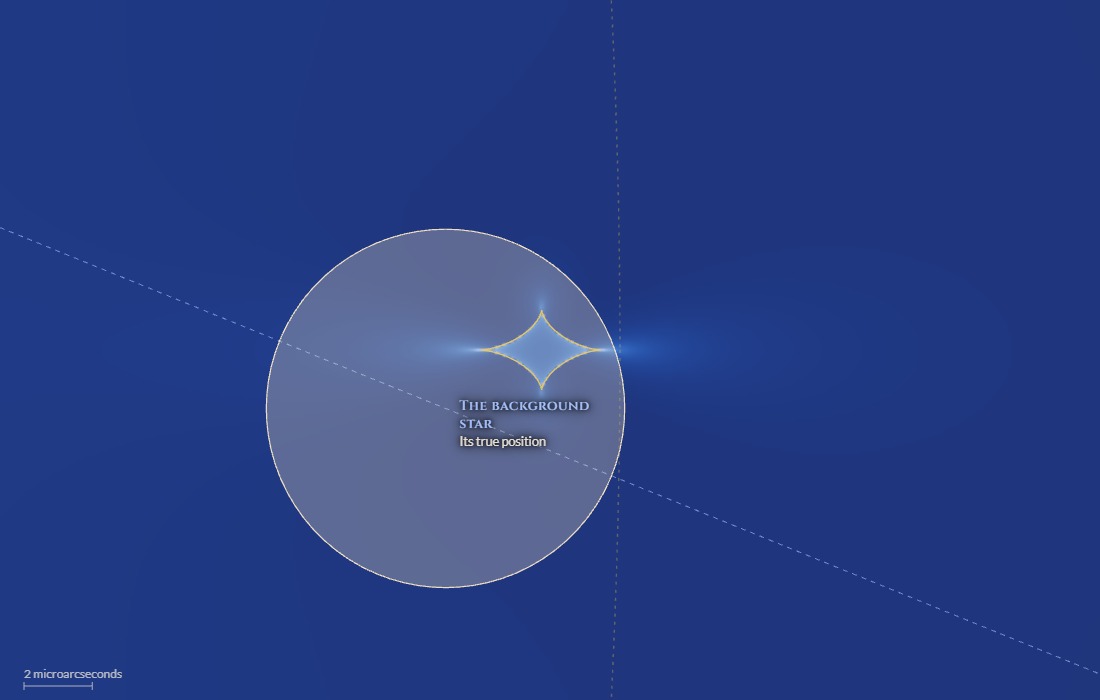 Close-up on the planet's caustic
Our solar system, seen from far away
If our own Sun were the lens, halfway to the centre of the galaxy, its Einstein ring would have a radius of 4 times the Earth–Sun distance, not far inside Jupiter's orbit at 5.2. That coincidence is why Jupiter-like planets are among the easiest to find. On a path that crosses Jupiter's caustic (left), the star briefly becomes almost five times brighter than the Sun alone would make it. Gould and Loeb estimated in 1992 that about one such event in five would show the planets of a system like ours, mostly through Jupiter. Earth, at a quarter of the ring's radius, changes the brightness by less than a thousandth of a percent (right): it would not be found.
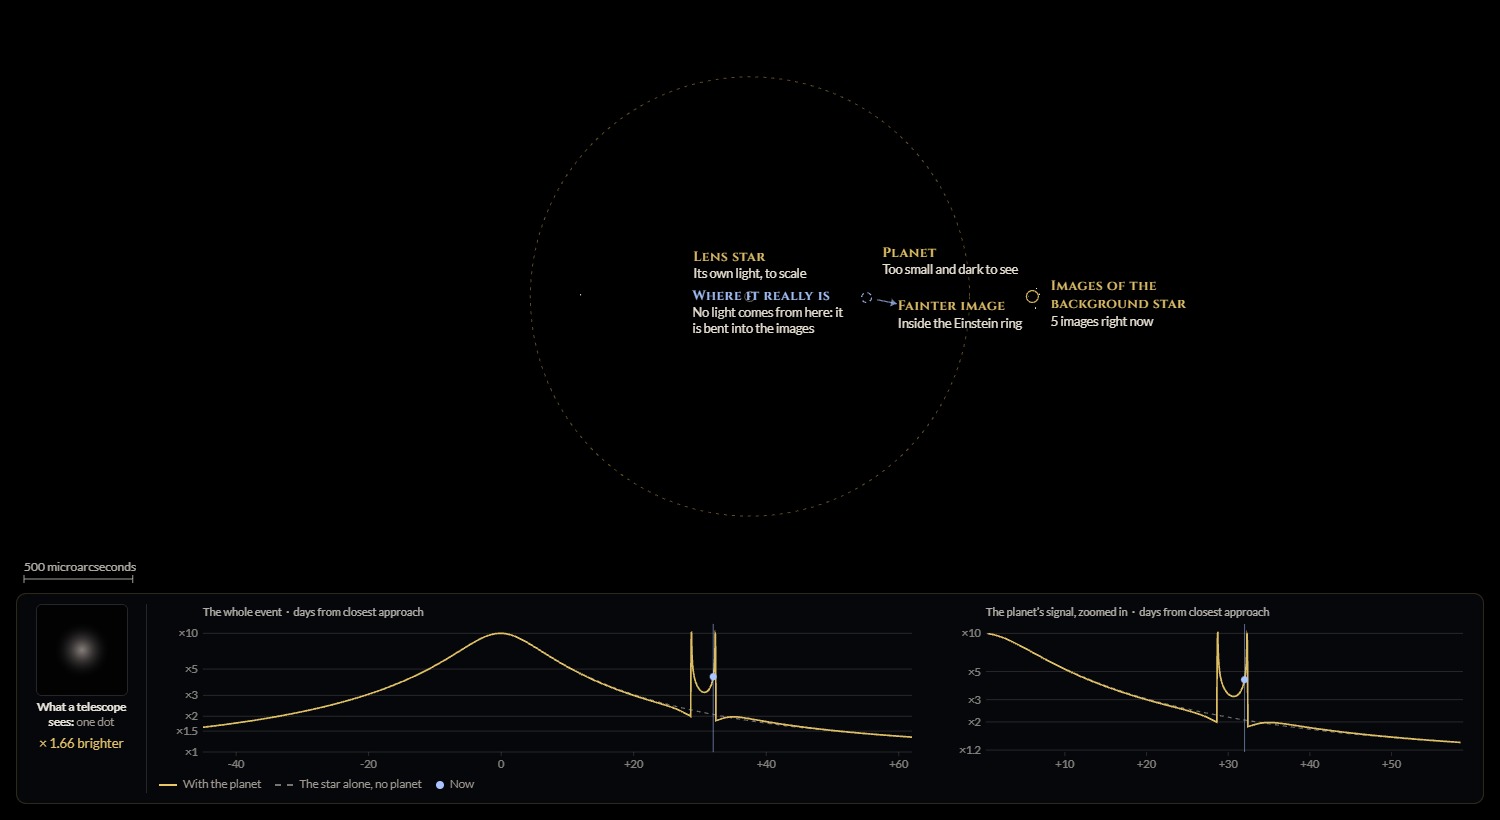 Sun and Jupiter
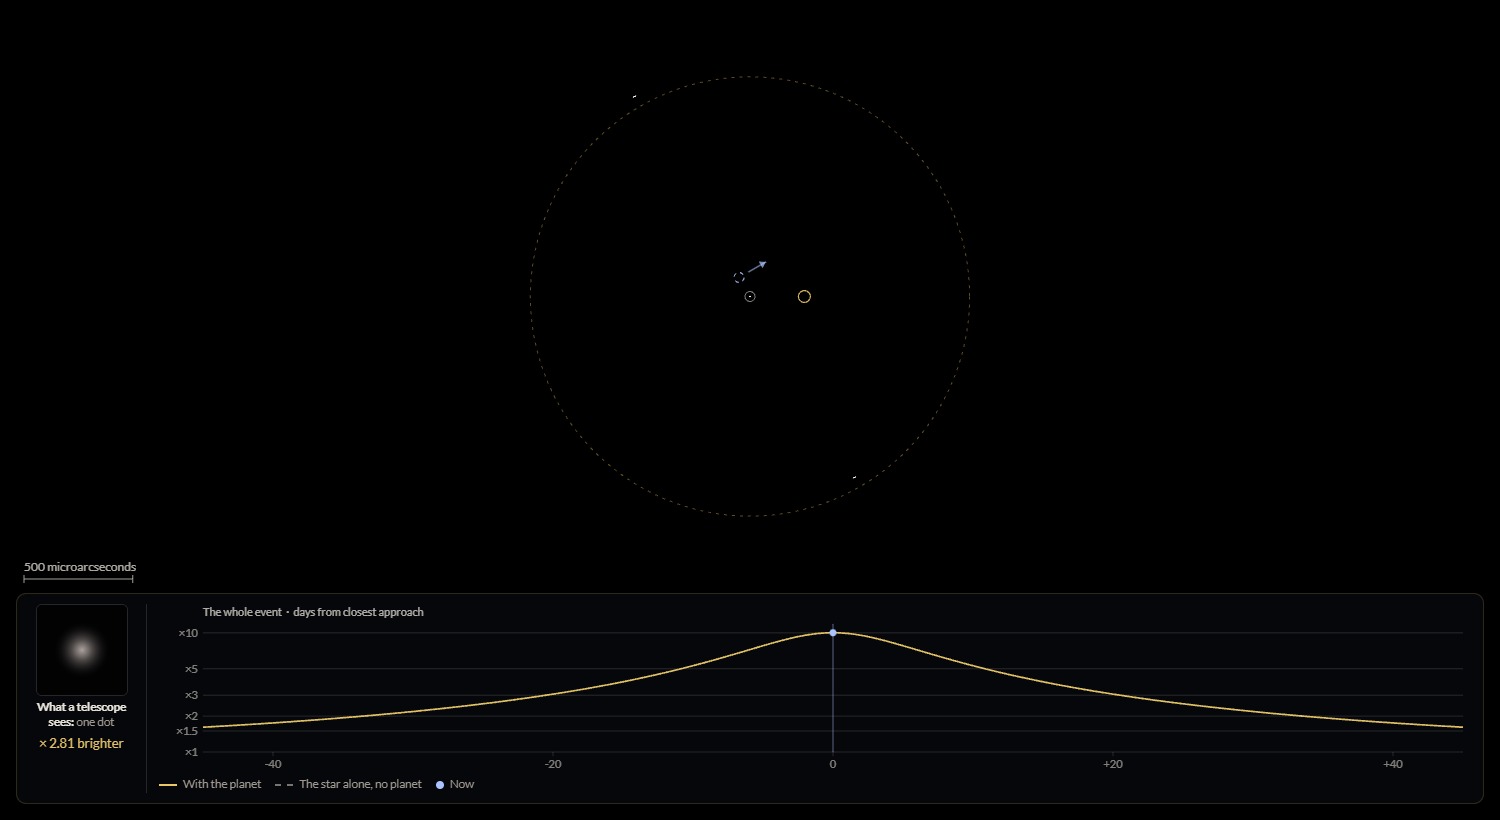 Sun and Earth: no signal
A star larger than the ring
OGLE-2016-BLG-1928 was probably caused by a planet with no star nearby, perhaps a third of Earth's mass. Its Einstein ring is more than three times smaller than the background star, so the star's image is barely changed except close to the lens, where it has a dark hole. The brightening was only 19% and lasted about six hours, and only 15 observations caught it.
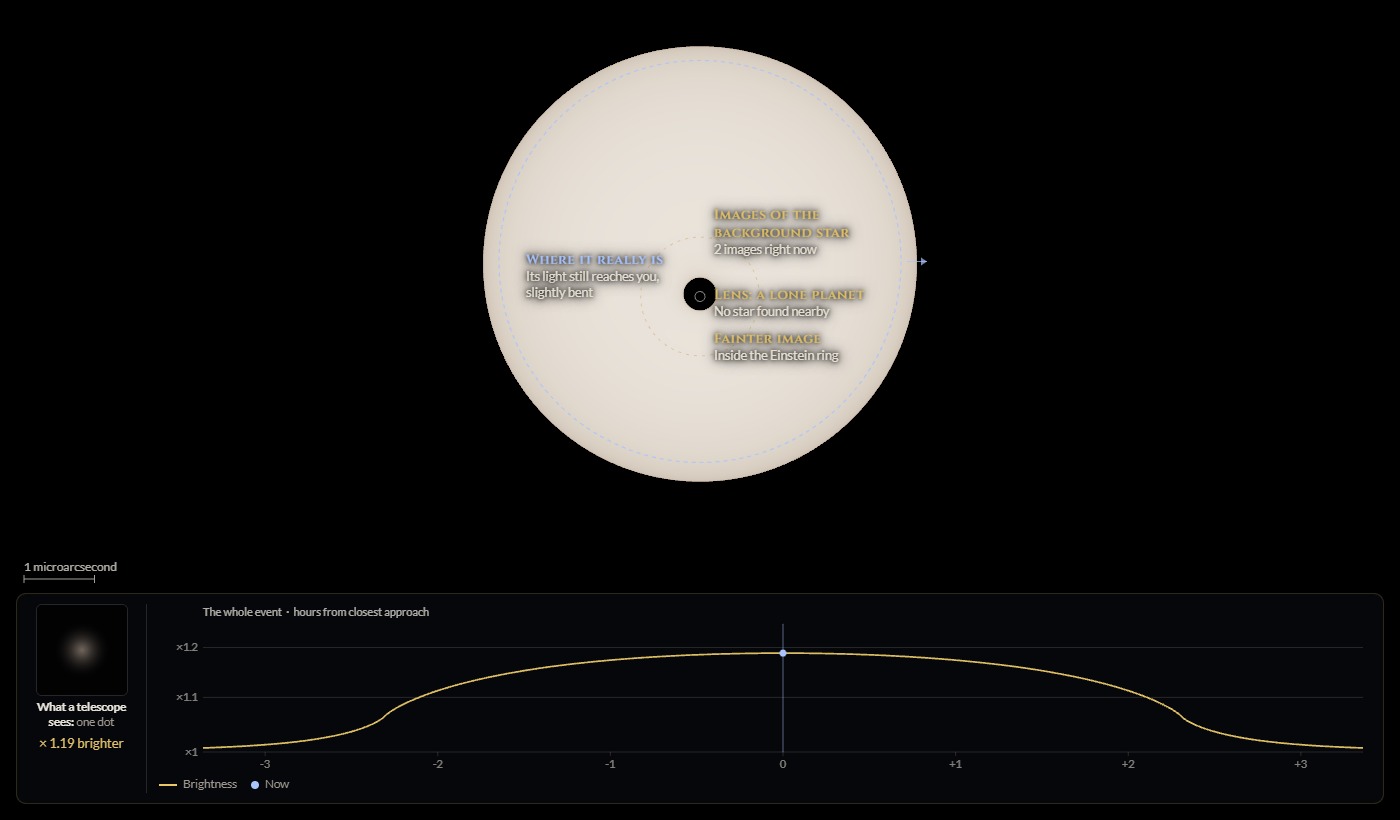
A Long Shot
"No Great Chance"
In 1936 a Czech engineer and amateur scientist, Rudi Mandl, persuaded Albert Einstein to publish a short calculation of how one star could act as a lens for another. Einstein concluded that "there is no great chance of observing this phenomenon," and told the editor of Science privately that the paper was "of little value, but it makes the poor guy happy." The alignments are too rare, and the nearer star's own light would swamp the effect.
Fifty years later, Bohdan Paczyński pointed out that if you watched millions of stars at once, about one in a million would be lensed at any moment. That was a way to test whether the unseen dark matter around our galaxy was made of dim objects. In 1991 he and Shude Mao showed that the method could also find planets, and in 1992 Andrew Gould and Avi Loeb showed that a planetary system like ours would leave its mark in about one event in five. By 1992 three surveys were watching (EROS from 1990, MACHO and OGLE from 1992), and in 1993 all three reported their first events. The first planet came in 2003, OGLE-2003-BLG-235, found by the OGLE and MOA teams.
Timescales
How Much Faster Than Real Time
Each event plays in about 22 seconds, slowing down where the brightness changes quickly. The last column is the average speed-up over the time shown.
| Event | Einstein time | Planet's signal | Lens | Faster than real time |
|---|---|---|---|---|
| OGLE-2005-BLG-390 | 11 days | A bump of 16%, about 1 day | Star and planet | 130,000× |
| OGLE-2003-BLG-235 | 62 days | Two caustic crossings, 7 days apart | Star and planet | 410,000× |
| OGLE-2016-BLG-1067 | 27 days | A dip of up to 21%, 2 to 3 days | Star and planet | 170,000× |
| OGLE-2004-BLG-254 | 13 days | None (a single star) | Star | 47,000× |
| OGLE-2016-BLG-1928 | 42 minutes | The whole event lasts about 6 hours | Rogue planet (candidate) | 1,100× |
| Sun and Jupiter | 61 days | Inside Jupiter's caustic for 3.7 days | Star and planet | 420,000× |
Method
How It's Computed
- The lens equation. Positions on the sky are measured in units of the Einstein radius of the total lens mass, θE = √(κMπrel), with κ = 4G/(c2 AU) = 8.144 milliarcseconds per solar mass and πrel = AU (1/DL − 1/DS). Writing positions as complex numbers, light seen at z comes from the point
ζ = z − Σi mi / (z̄ − z̄i)behind the lens, for lens masses mi (fractions of the total) at zi. The bending angles are about a milliarcsecond, so for the lens equation itself this weak-field, thin-lens form is accurate to about one part in a hundred million. The star is at −sq/(1+q) and the planet at s/(1+q) on the x axis; the background star moves in a straight line at angle α to that axis, passing the centre of mass at distance u0 at time t0, and moving one Einstein radius in the Einstein time tE.
- The picture. Each pixel maps through the lens equation to a point near the background star, a disk with linear limb darkening, I = 1 − u(1 − μ). Lensing doesn't change surface brightness, so the pixel takes the star's brightness at that point. Where the star or its image is smaller than a pixel, the pixel is split into 16 or 64 parts, each part's area is carried through the lens map (its Jacobian), and the star's light falling inside it is estimated with a Gaussian of the same size and shape. Summed over the picture, this keeps the star's light within 0.1% of the light-curve calculation when the star is larger than a pixel, and within about 5% when it is much smaller (the worst case is a star sitting exactly on a caustic). When the star is much smaller than a pixel, the whole display is brightened by one factor so that it stays visible; relative brightnesses are kept. Colours are blackbodies at each star's temperature, without the reddening by dust that real stars toward the centre of the galaxy have.
- Images of a point. Eliminating z̄ turns the lens equation into a polynomial, of degree 5 for a star and a planet (Witt 1990), whose roots include all 3 or 5 images. The roots are found by the Aberth–Ehrlich method in double precision, in coordinates centred on the planet (otherwise a planet of 10−5 of its star's mass loses half the digits), polished with Newton's method on the lens equation itself, and roots that don't satisfy it are discarded. Each image's magnification is 1/|det J|, with det J = 1 − |Σ mi/(z̄ − z̄i)2|2.
- Caustics. The critical curve, where det J = 0, solves Σ mi/(z − zi)2 = eiφ, a polynomial of degree 4 for each φ; the caustics are its images under the lens equation.
- The light curve. The magnification of the star's disk is the total area of its images divided by the area of the disk. Away from caustics it uses Gould's (2008) expansion from 13 point magnifications; near them, contour integration (Gould & Gaucherel 1997; Bozza 2010). The images of the disk's edge are linked into curves, image pairs that appear or vanish on the critical curve are joined, the enclosed areas are added by Green's theorem, and the edge is sampled adaptively, with points forced where it crosses a caustic. Limb darkening is exact through integration by parts:
flux = (1 − u) L(1) + u ∫01 L(√(1 − μ2)) dμ,where L(x) is the lensed area of an evenly bright disk of x times the star's radius; the integral is adaptive and split where the disk's edge first touches a caustic. On the page the tolerance is 10−4. The light curves are calculated in background threads, and a quick point-source version is shown first.
- The common picture. "Two separate lenses" adds the light curves of the star alone and the planet alone, each with its own Einstein radius and the same star size: A = Astar + Aplanet − 1.
- Real events. Each event uses the published fit (see References). Papers rarely state every convention, so each orientation was checked against a published time: the planet's bump in OGLE-2005-BLG-390 on 9–10 August (here +9.4 to +10.4 days, which needs the paper's angle plus 180°), the caustic crossings of OGLE-2003-BLG-235 on about days 2835 and 2842 (here −12.8 and −6.0 days from t0 = 2848.06), and the dip in OGLE-2016-BLG-1067 starting about 2.7 days before t0 (here 3.0). Calchi Novati et al. measure u0 with the opposite sign from ours: in our convention their solution is u0 = +0.470 with their α = 1.427 rad (their sign gives no dip at all). Values that are ours rather than published: for OGLE-2005-BLG-390, ρ = t*/tE, u from the published Γ (u = 3Γ/(2 + Γ)) and θE = θ*/ρ; for OGLE-2016-BLG-1067, ρ = θ*/θE with θE from the estimated mass and distance, and u from Γ; for OGLE-2003-BLG-235, u = 0.6 (assumed; the paper only names the star's type); for OGLE-2016-BLG-1928, the lens distance of a disk lens. The lens stars' sizes and temperatures are typical values for their estimated masses.
Verification
A separate Python program, written independently of the page, solves the same problems in a different way: the images at 40-digit precision, the caustics, and the magnification of finite stars by brute-force ray shooting (and, for a single lens, by Witt and Mao's exact formula and a separate integral). The page's own code is run against it in a browser.
| Test | Result |
|---|---|
| Images of a point source: 113 cases, single lens and star + planet with mass ratios from 1 to 10−5, inside and outside caustics | Every image found; positions within 6 × 10⁻¹², magnifications within 3 × 10⁻¹¹ |
| The same for Earth-like mass ratios, 3 × 10⁻⁶ and 10−6 (50 cases) | Every image found; positions within 3 × 10⁻¹³, magnifications within 10−9 |
| Caustics of 6 star + planet lenses (1,200 reference points) | Within 4 × 10⁻¹⁴ Einstein radii; the number of caustics (1, 2 or 3) right in every case |
| Separations where the caustics merge or split (Erdl & Schneider 1993; Dominik 1999) | Agree with the reference's count of caustic loops to 3 × 10⁻¹⁰ |
| A finite, limb-darkened star: 42 cases, radius 0.001 to 0.3 Einstein radii, from far away to straddling cusps and caustics | Within the reference's own uncertainty (2 × 10⁻⁵); 1.2 × 10⁻⁴ at the page's tolerance |
| Light in the picture (graphics card, summed) vs the light curve, 14 cases from resolved stars to stars much smaller than a pixel | Within 0.1% where the star is larger than a pixel; within 5.4% for a star smaller than a pixel on a caustic |
| Einstein ring of an evenly bright disk, √(1 + 4/ρ2) | Within 10−9 |
| Published times of the planets' signals (above) | OGLE-2003-BLG-235 within its quoted ±0.5 day; the others to about a day, as precisely as the papers state them |
| OGLE-2016-BLG-1067 peak (published about ×2.5) | ×3.0 here, from a cusp the still model passes closer to (see the figure caption) |
Limits
What This Model Leaves Out
- Only the background star moves. The planet doesn't move along its orbit during the event, and Earth's own motion around the Sun (parallax) is left out. Several of the published fits include these effects; the events here use the still part of each fit, which sets the shape of the planet's signal but won't match the real data exactly. OGLE-2016-BLG-1067's fit also includes the view from the Spitzer telescope in space; without it our path passes closer to a cusp, so the peak reaches ×3.0 instead of the observed ×2.5.
- One planet. Systems with two planets, or two stars and a planet, need a lens of three bodies; this page does one star and one planet.
- The picture is a stand-in. The images are hundreds to thousands of times smaller than a telescope's blur and have been resolved only for a few bright events, with interferometers. The enlarged view shows what the calculation says is there; where the star is smaller than a pixel, each pixel's light is an estimate (see Method).
- Colours. Stars are drawn as blackbodies at their temperatures, as if there were no dust. Real stars toward the centre of our galaxy are dimmed and reddened by dust, and limb darkening is stronger in blue light than in red, which gives real caustic crossings slightly different shapes in different colours.
- The lens star. Its size and colour come from typical stars of its estimated mass. Its light is included in the telescope dot but not in the light curve, and real light curves also include light from unrelated stars that sit in the same blur.
- Chosen paths. The "Sun and Jupiter" path was chosen to cross Jupiter's caustic; most paths would miss it. "Sun and Earth" uses an ordinary path.
- Estimates. The planet and star masses and distances shown are those published for each event, mostly statistical estimates; those of OGLE-2003-BLG-235 were later measured with Hubble. OGLE-2016-BLG-1928 is a candidate: a distant host star can't be ruled out, and its mass depends on its unknown distance.
I'm sure I've gotten some details wrong, so corrections are welcome.
Sources
References
- Einstein, A. (1936). Lens-like action of a star by the deviation of light in the gravitational field. Science, 84, 506. DOI
- Renn, J., & Sauer, T. (2000). Eclipses of the stars: Mandl, Einstein, and the early history of gravitational lensing. MPIWG Preprint 160. PDF
- Chang, K., & Refsdal, S. (1979). Flux variations of QSO 0957+561 A, B and image splitting by stars near the light path. Nature, 282, 561. DOI
- Paczyński, B. (1986). Gravitational microlensing by the galactic halo. The Astrophysical Journal, 304, 1. DOI
- Mao, S., & Paczyński, B. (1991). Gravitational microlensing by double stars and planetary systems. The Astrophysical Journal, 374, L37. DOI
- Gould, A., & Loeb, A. (1992). Discovering planetary systems through gravitational microlenses. The Astrophysical Journal, 396, 104. DOI
- Alcock, C., et al. (1993). Possible gravitational microlensing of a star in the Large Magellanic Cloud. Nature, 365, 621. DOI. Aubourg, E., et al. (1993). Evidence for gravitational microlensing by dark objects in the Galactic halo. Nature, 365, 623. DOI. Udalski, A., et al. (1993). Discovery of the first candidate microlensing event in the direction of the Galactic bulge. Acta Astronomica, 43, 289.
- Bond, I. A., et al. (2004). OGLE 2003-BLG-235/MOA 2003-BLG-53: a planetary microlensing event. The Astrophysical Journal, 606, L155 (Table 1). DOI
- Bennett, D. P., et al. (2006). Identification of the OGLE-2003-BLG-235/MOA-2003-BLG-53 planetary host star. The Astrophysical Journal, 647, L171. DOI
- Beaulieu, J.-P., et al. (2006). Discovery of a cool planet of 5.5 Earth masses through gravitational microlensing. Nature, 439, 437 (Table 1). DOI
- Cassan, A., et al. (2006). OGLE 2004-BLG-254: a K3 III Galactic bulge giant spatially resolved by a single microlens. Astronomy & Astrophysics, 460, 277 (Table 1). DOI
- Calchi Novati, S., et al. (2019). Spitzer microlensing parallax for OGLE-2016-BLG-1067: a sub-Jupiter orbiting an M dwarf in the disk. The Astronomical Journal, 157, 121 (Table 1). DOI
- Mróz, P., et al. (2020). A terrestrial-mass rogue planet candidate detected in the shortest-timescale microlensing event. The Astrophysical Journal Letters, 903, L11 (Table 1). DOI
- Mróz, P., et al. (2019). Microlensing optical depth and event rate toward the Galactic bulge from 8 years of OGLE-IV observations. The Astrophysical Journal Supplement, 244, 29. DOI
- Gaudi, B. S., & Gould, A. (1997). Planet parameters in microlensing events. The Astrophysical Journal, 486, 85. DOI
- Witt, H. J. (1990). Investigation of high amplification events in light curves of gravitationally lensed quasars. Astronomy & Astrophysics, 236, 311. ADS
- Witt, H. J., & Mao, S. (1994). Can lensed stars be regarded as pointlike for microlensing by MACHOs? The Astrophysical Journal, 430, 505. DOI
- Erdl, H., & Schneider, P. (1993). Classification of the multiple deflection two point-mass gravitational lens models. Astronomy & Astrophysics, 268, 453. ADS. Dominik, M. (1999). The binary gravitational lens and its extreme cases. Astronomy & Astrophysics, 349, 108. ADS
- Gould, A., & Gaucherel, C. (1997). Stokes's theorem applied to microlensing of finite sources. The Astrophysical Journal, 477, 580. DOI
- Gould, A. (2008). Hexadecapole approximation in planetary microlensing. The Astrophysical Journal, 681, 1593. DOI
- Bozza, V. (2010). Microlensing with an advanced contour integration algorithm: Green's theorem to third order, error control, optimal sampling and limb darkening. Monthly Notices of the Royal Astronomical Society, 408, 2188. DOI. Bozza, V., et al. (2018). VBBinaryLensing: a public package for microlensing light-curve computation. MNRAS, 479, 5157. DOI
- Aberth, O. (1973). Iteration methods for finding all zeros of a polynomial simultaneously. Mathematics of Computation, 27, 339. DOI
- Vandorou, A., et al. (2025). OGLE-2016-BLG-1195Lb: a sub-Neptune beyond the snow line of an M dwarf confirmed by Keck adaptive optics. The Astronomical Journal, 169, 319. DOI
- Dong, S., et al. (2019). First resolution of microlensed images. The Astrophysical Journal, 871, 70. DOI
- Sahu, K. C., et al. (2022). An isolated stellar-mass black hole detected through astrometric microlensing. The Astrophysical Journal, 933, 83. DOI
- Penny, M. T., et al. (2019). Predictions of the WFIRST microlensing survey. I. Bound planet detection rates. The Astrophysical Journal Supplement, 241, 3. DOI
- NASA (2026). NASA's dark-universe-seeking Nancy Grace Roman Space Telescope launches. News release, 30 August 2026. Link
- NASA Exoplanet Archive: planets by discovery method (accessed 11 October 2026). Link
- Wyman, C., Sloan, P.-P., & Shirley, P. (2013). Simple analytic approximations to the CIE XYZ color matching functions. Journal of Computer Graphics Techniques, 2(2), 1. Link
Notes on the numbers: one milliarcsecond is 4.85 × 10⁻⁹ radians, which at the Moon's 384,400 km is 1.86 m; the atmosphere's typical 0.8″ blur there is 1.49 km; a Sun-sized star at 8 kpc spans 1.16 microarcseconds, 2.2 mm at the Moon. A Sun-mass lens at 4 kpc with a source at 8 kpc has θE = √(8.144 × 0.125) = 1.009 mas, which at 4 kpc is 4.04 AU. A planet's signal lasts roughly tE√q: for tE = 30 days, 22 hours for Jupiter's mass ratio and 1.2 hours for Earth's. 8 kpc is 26,100 light-years; 6.6 kpc, the estimated distance of OGLE-2005-BLG-390, is 21,500. The fraction of bulge stars lensed at any moment (the optical depth) is about 1 to 2 × 10⁻⁶ (Mróz et al. 2019). OGLE-2016-BLG-1928's Einstein time is 0.0288 days, 41.5 minutes; for a lens in the galactic disk its mass is θE2/(κπrel) ≈ 0.3 Earth masses. All other numbers about the events are computed by the simulator from the published parameters.
Use These Images
Free to Use, With Credit
Images and recordings you make with this simulator, and the figures on this page, may be used for any purpose, including teaching, publication and commercial work, without asking permission. We only ask that you credit Frosty Wren Studios, for example:
Microlensing simulation: Frosty Wren Studios, frostywren.com/microlensing"Save image" adds this line to the corner of each picture by default; you can switch it off under Playback and output. The simulator's source code is not covered by this permission. The simulator uses only the published parameters of each event, and no survey photometry. This research has made use of the NASA Exoplanet Archive, which is operated by the California Institute of Technology, under contract with the National Aeronautics and Space Administration under the Exoplanet Exploration Program.