The Idea in One Picture
The Stars Crowd Ahead
Every picture of the sky on this page is rendered by the simulator from the equations of special relativity, real star catalogues and real all-sky maps, and checked against an independent calculation; the diagram and the chart come from the same equations. Nothing is drawn, painted or retouched.
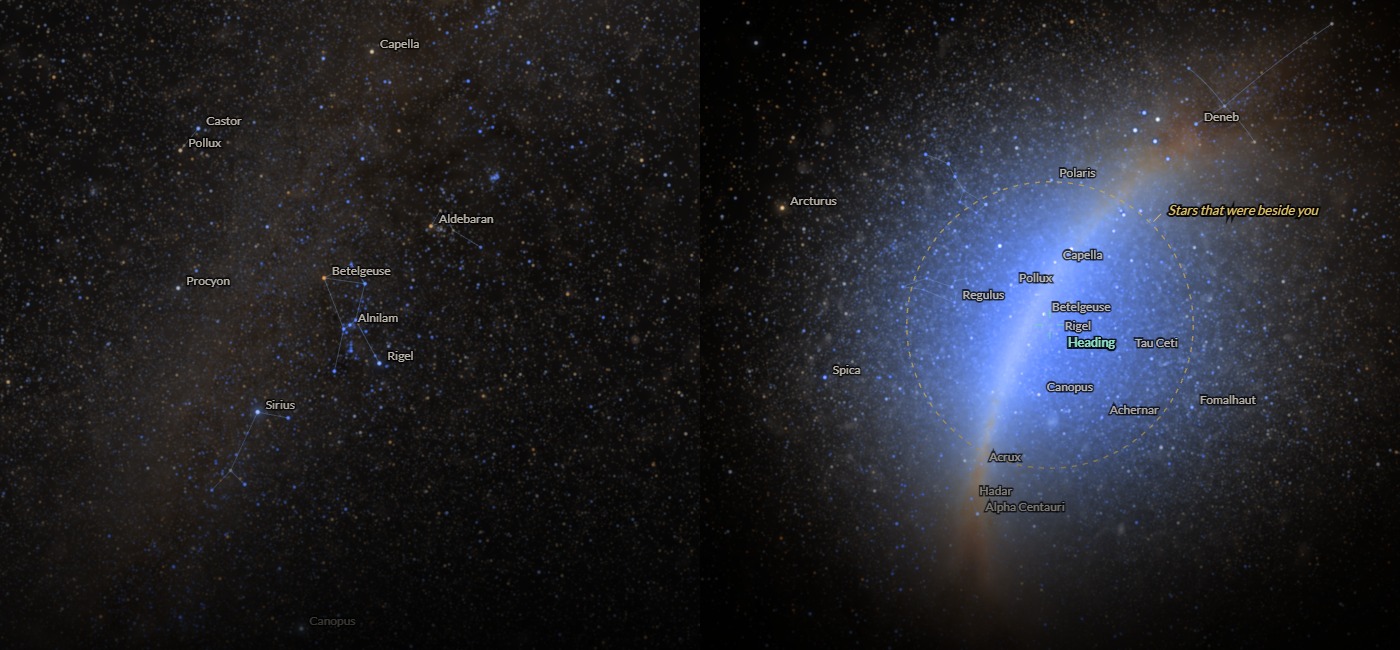
The stars move the wrong way
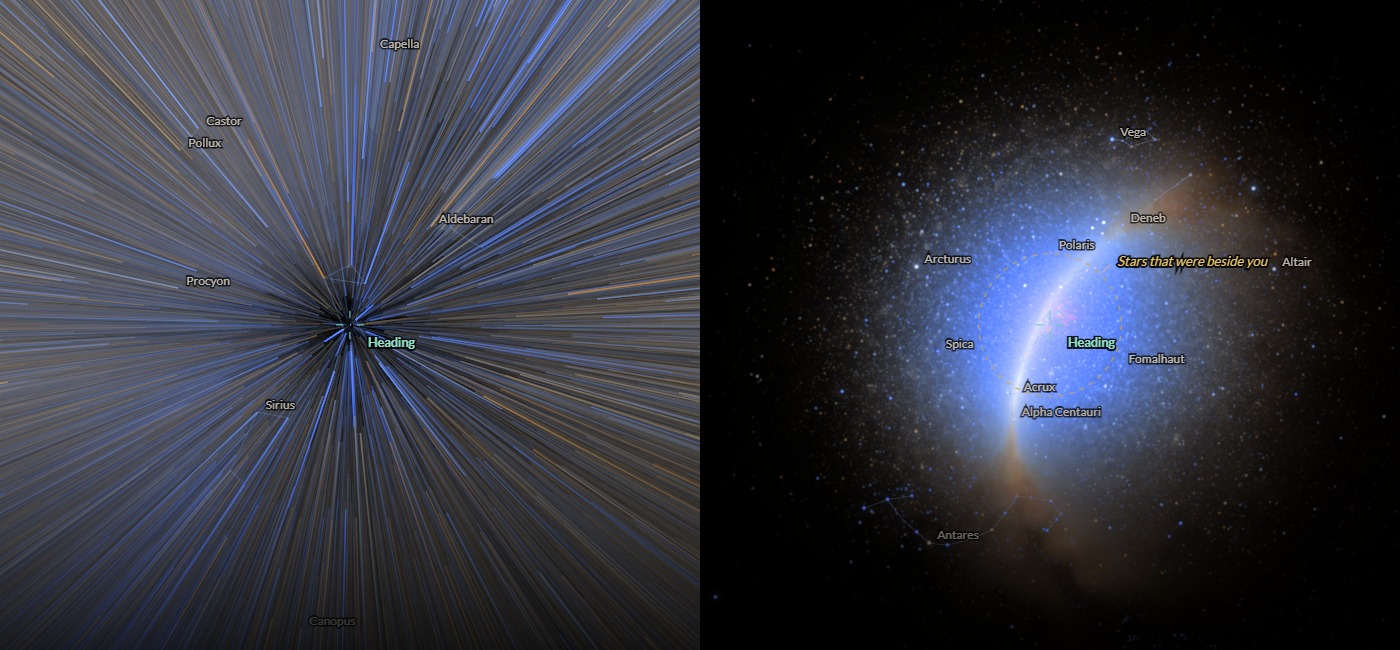
In films, the stars rush outward past a ship as it speeds up. The calculation shows the opposite: they slide toward the point the ship is heading for. The stars themselves aren't moving. Their light reaches the moving ship at a slant, the way vertical rain seems to come at you from the front when you run through it.
The colours shift
Light from ahead arrives with its frequency raised, so the stars there look bluer; light from behind arrives redder and dimmer, until the sky behind goes dark. At 90% of light speed every frequency ahead is multiplied by 4.4, and every frequency behind by 0.23.
The sky ahead starts to glow
Space is full of light our eyes can't see: infrared from the Milky Way's stars and dust, and from all the galaxies in the universe. Near light speed that light is shifted into the visible and crowded ahead, until, heading toward Orion at 99.99% of light speed, the sky in front of the ship is brighter than a clear daytime sky.
About This Page
A Simulation, Not an Animation
Try this first. You're on a spaceship, looking out of the front window, and the ship speeds up to 99% of the speed of light. What happens to the stars?
Most people picture the jump to hyperspace from Star Wars: stars stretching into streaks that fly outward past you. Here is what the physics says. The stars slide inward, toward the point you're heading for, until half the sky is squeezed into a circle 16° across. They turn blue-white, the sky behind you goes dark, and the space between the stars ahead begins to glow.
The simulator shows the real night sky: 270,000 stars from the Henry Draper Catalogue, the great survey of starlight made at Harvard a century ago, each in its catalogued place with its brightness and the colour of its spectral type, together with the Milky Way's glow, measured in the near infrared by the COBE satellite, and the light of the dust between the stars. The ship starts beside the Sun, heading for Orion's Belt, and the default view shows the sky standing still on the left and the same sky from the ship on the right, as it speeds up to 99% of light speed and slows down again. You can choose the speed and the heading, look back the way you came, see the whole sky on one disc, fly to Alpha Centauri, or switch each piece of physics off to see what it does. Hold the pointer over any view, setting or number for a short explanation.
Three things change what you see, and all three come from special relativity. Aberration changes the direction light seems to come from, so the stars appear crowded toward the front. The Doppler shift raises the frequency of light from ahead and lowers it from behind, which changes the colours. And because a star's light arrives concentrated into a smaller patch of sky, its brightness changes too: some stars brighten, others fade, and light that was invisible becomes visible.
Calculated, not drawn. Every star is placed by the exact formula for aberration, coloured by its temperature shifted by the Doppler factor, and given the brightness its shifted spectrum would have, all recalculated by your graphics card in every frame. The glow comes from real maps of the sky and measured spectra, shifted the same way. There is nothing in the program that says "make the stars gather" or "make the sky glow"; it all comes out of the physics, and an independent program checks the result (see Method and sources). It runs best on a laptop or desktop. Built with Claude Opus 5.5.
What You're Seeing
Reading the Image
What's on screen
The view through a very wide lens, about 110° from top to bottom, looking in the direction the ship is travelling. The small green cross marks the heading. A few familiar constellations are joined by faint lines and the brightest stars are named, so you can follow them as they move.
The stars aren't moving
Nothing out there changes; only the ship's speed does. A star's light reaches the moving ship from a direction tilted toward the front, by more the faster the ship goes. James Bradley discovered this in 1725–28: because the Earth moves around the Sun at 30 km/s, every star shifts by up to 20.5 arcseconds over a year.
The dashed circle
The stars that were beside the ship, 90° from the heading, now appear on the dashed circle, and everything that was in front of the ship is inside it. The circle shrinks as the ship speeds up: 60° from the heading at half the speed of light, 26° at 90%, 8° at 99% and 2.6° at 99.9%.
Constellations keep their shape
Orion shrinks as it crowds toward the heading, but it isn't stretched or bent: aberration keeps the shapes of small patterns, and a circle on the sky stays a circle. Seen through a lens like this one, centred on the heading, the whole effect is exactly a zoom. "Zoom in to undo the crowding" magnifies the view by just the right amount, and Orion comes back at its normal size, now bluer.
Red stars brighten, blue stars fade
Shifting a star's light to higher frequencies doesn't make every star brighter. Cool red stars give off most of their light in the infrared, and shifting it into view makes them much brighter; hot blue stars push their light into the ultraviolet and fade. At 90% of light speed red Betelgeuse, normally about as bright as blue Rigel, is nearly twenty times brighter than it, and more than a hundred times brighter than the blue stars of Orion's Belt.
More stars, then fewer
At rest, about 8,200 stars are bright enough to see with the naked eye. At 90% of light speed, because so many faint red stars brighten, there are about 28,000, nearly all of them crowded ahead. At 99.99% only about 6,400 are left: past a certain speed, even the red stars ahead fade, while their combined light keeps growing.
Behind goes dark
Looking back, the stars slide away from the point you came from, turn red and fade. By 90% of light speed only 17 stars bright enough for the naked eye are left in the whole back half of the sky, and by 99% there are none.
A glow ahead
The bright haze ahead is not drawn in. It is light that was already there, too red to see: the near-infrared starlight of the Milky Way, then the infrared glow of its dust, then the light of all the galaxies, and at the most extreme speeds the afterglow of the Big Bang. "Glow straight ahead" in the panel gives its brightness, compared with skies on Earth. The picture shows it as a camera with a long exposure would, so it can look brighter than it is: at 99% of light speed the glow is about as bright as the sky late in twilight, not dazzling.
In Everyday Terms
How Fast Is Fast Enough?
The workings for each number are in the notes on the method page.
At a Glance
The Numbers Behind the Image
| Speed | Front half of the sky fits within | Frequencies ahead × / behind × | Stars visible to the naked eye | Glow straight ahead (toward Orion) |
|---|---|---|---|---|
| At rest | 90° | 1 / 1 | 8,200 | 0.00009 cd/m², darker than the night sky on Earth |
| 50% | 60° | 1.7 / 0.58 | 12,800 | 0.001 cd/m², like a night sky on Earth |
| 90% | 26° | 4.4 / 0.23 | 27,800 | 0.02 cd/m², brighter than a moonlit sky |
| 99% | 8.1° | 14 / 0.071 | 27,400 | 0.5 cd/m², like the sky late in twilight |
| 99.9% | 2.6° | 45 / 0.022 | 15,200 | 56 cd/m², like the sky soon after sunset |
| 99.99% | 0.81° | 141 / 0.0071 | 6,400 | 13,000 cd/m², brighter than a clear daytime sky |
Stars counted down to magnitude 6.5, the naked-eye limit, in the catalogue used here. The glow is the light spread across the sky straight ahead, heading toward Orion, without the stars themselves; at 99% and above it is probably an underestimate (see the limits below). The comparison skies are rounded.
The Surprise
The Sky Ahead Glows
While working on this, I was surprised to find that the most striking thing at high speed isn't the stars at all. The well-known calculations of what a relativistic traveller would see, going back to the 1970s, deal with the stars. But space between the stars isn't dark: it is filled with light our eyes can't see. The Milky Way's billions of faint stars shine most brightly in the near infrared; the dust between them glows at a few tens of degrees above absolute zero, in the far infrared; all the galaxies in the universe add a faint infrared glow from every direction; and behind it all is the cosmic microwave background, the afterglow of the Big Bang, at 2.7 K.
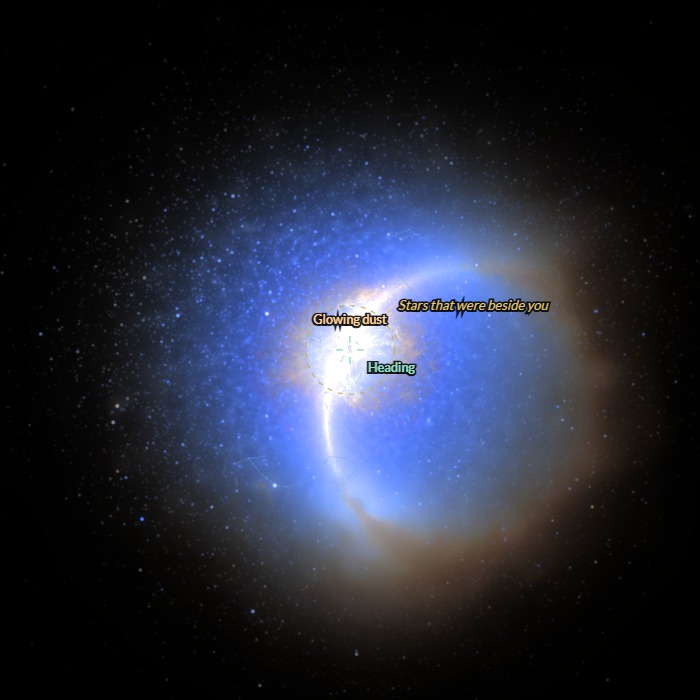
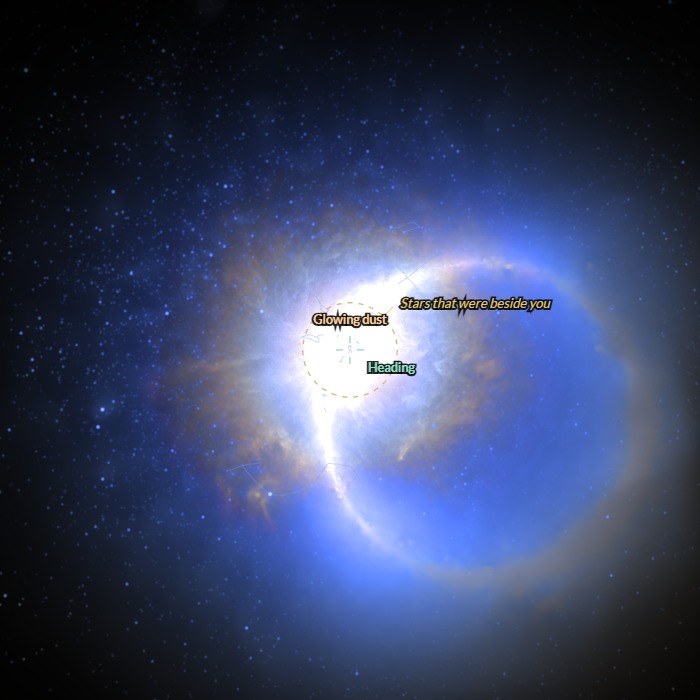
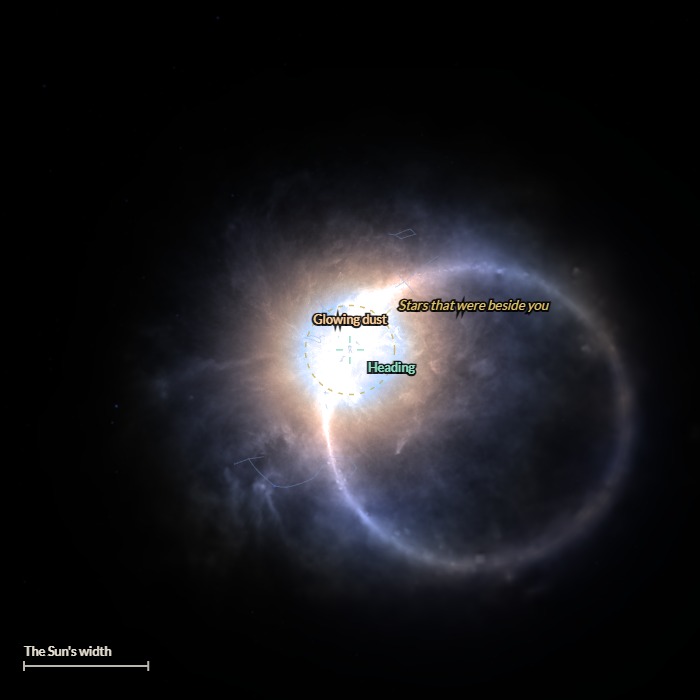
Near light speed, all of that light ahead is shifted to higher frequencies and concentrated into a smaller patch of sky, and one after another these sources become visible. Heading toward Orion, the Milky Way's starlight is the brightest of them up to about 98% of light speed (probably a little less; see the limits); from there the infrared glow of its dust takes over, and the Big Bang's afterglow becomes the brightest thing ahead only at 99.9997%. The chart shows how bright each one is straight ahead. You can switch each of them off in the simulator, under Physics.
Table of values
| Speed | Milky Way starlight | Dust | Galaxies | Big Bang's afterglow |
|---|---|---|---|---|
| 2.0% | 9.3e-5 | 0 | 9.6e-7 | 0 |
| 52.3% | 1.4e-3 | 0 | 1.4e-5 | 0 |
| 80.0% | 8.4e-3 | 0 | 1.1e-4 | 0 |
| 90.5% | 2.3e-2 | 1.2e-11 | 4.0e-4 | 0 |
| 95.6% | 4.9e-2 | 4.1e-4 | 1.3e-3 | 0 |
| 98.0% | 9.3e-2 | 4.4e-2 | 4.0e-3 | 0 |
| 99.101% | 1.6e-1 | 4.7e-1 | 1.6e-2 | 0 |
| 99.595% | 2.6e-1 | 3.6e0 | 8.5e-2 | 0 |
| 99.818% | 4.2e-1 | 1.8e1 | 4.5e-1 | 0 |
| 99.9181% | 6.5e-1 | 7.9e1 | 2.6e0 | 0 |
| 99.9632% | 1.0e0 | 4.5e2 | 1.8e1 | 0 |
| 99.9835% | 1.5e0 | 3.3e3 | 1.2e2 | 3.1e-22 |
| 99.99257% | 2.3e0 | 2.9e4 | 8.7e2 | 2.7e-12 |
| 99.99666% | 3.5e0 | 2.0e5 | 6.5e3 | 2.8e-5 |
| 99.99850% | 5.2e0 | 7.3e5 | 3.0e4 | 2.4e0 |
| 99.999326% | 7.8e0 | 1.6e6 | 8.7e4 | 6.6e3 |
| 99.999697% | 1.2e1 | 2.4e6 | 1.9e5 | 1.6e6 |
| 99.999864% | 1.7e1 | 2.7e6 | 3.0e5 | 6.6e7 |
| 99.9999388% | 2.6e1 | 2.6e6 | 4.3e5 | 8.5e8 |
| 99.9999725% | 3.9e1 | 2.3e6 | 5.7e5 | 4.9e9 |
| 99.9999775% | 4.3e1 | 2.2e6 | 6.1e5 | 7.0e9 |
 99.9% (40° view)
 99.99% (12° view)
 γ = 300 (3° view)
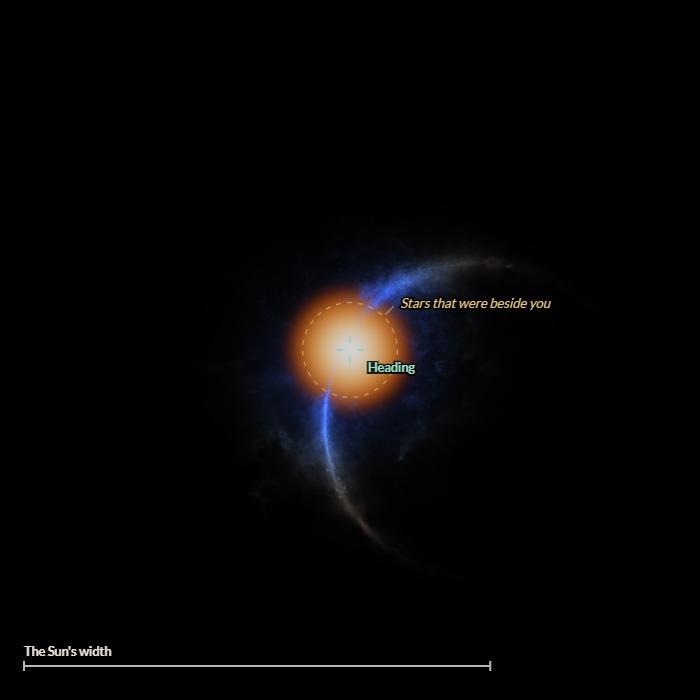 γ = 1,059 (0.8° view)
The Milky Way's starlight
The light of stars too faint to draw one by one, measured at 1.25 µm by the COBE satellite with the catalogue stars removed. At rest it is the faint band of the Milky Way; at 90% of light speed it is already brighter, straight ahead, than a moonlit sky.
The dust between the stars
Interstellar dust absorbs starlight and gives it out again as infrared heat. Toward Orion there is a lot of it: at 99.9% of light speed its glow, shifted from wavelengths around 25 µm into the visible, is more than 20 times brighter than everything else ahead combined, stars included.
All the galaxies
The combined light of every galaxy there has ever been, measured by counting galaxies in deep images from the ultraviolet to the far infrared. Toward the clearest parts of the sky, far from the Milky Way's dust, it becomes the brightest light ahead at about γ = 200, until the Big Bang's afterglow takes over.
The Big Bang's afterglow
The coldest light of all, but there is a lot of it: about 400 photons in every cubic centimetre of space. It takes over at the most extreme speeds. At γ = 1,059 its peak, normally at a wavelength of about 1 mm, arrives as green-yellow light at 502 nm, and the patch more than half as hot as the centre is a fifth as wide as the Sun.
A Long-Lived Idea
No Starbow, No Streaks
In 1962 the rocket engineer Eugen Sänger worked out what the crew of a fast photon rocket would see. He predicted a dark spot around the star they had left and another around the star ahead, with rings of colour between them, violet at the front through to red at the back: a rainbow wrapped around the sky. The science-fiction writer Frederik Pohl gave it a name in his story "The Gold at the Starbow's End" (1972), and the starbow became a fixture of science fiction.
The trouble was that Sänger treated every star as shining at a single wavelength. Real stars shine across the whole spectrum, roughly like a hot glowing body, and shifting that kind of spectrum only moves a star's colour along the line from red through white to pale blue. In 1979 the physicists McKinley and Doherty ran the calculation with real star temperatures and concluded that no starbow appears. The calculation here agrees. The stars ahead turn blue-white and those behind turn orange and red, with no rainbow ring and no dark spot ahead, and the glow ahead varies in the same way, between warm white and blue-white.
The streaks of the movies are a different idea. Star Wars (1977) shows the jump to hyperspace, which is faster-than-light fiction, and the image of stars stretching outward past a ship has stuck as the picture of travelling fast. A ship speeding up toward light speed would see something quite different: the stars sliding inward, toward where it's going.
How Scientists Measure It
We Already Measure This
Nothing human-made has gone fast enough to see the sky crowd ahead, but astronomers measure the same two effects every day at much lower speeds. Aberration was found by James Bradley in 1725–28, while he was looking for something else: the tiny shift of a star caused by our changing viewpoint as the Earth goes round the Sun. Instead he found a larger shift, up to 20.5 arcseconds, caused by the Earth's speed of 30 km/s. Space telescopes that measure star positions to a millionth of that, such as Gaia, correct for the aberration from their own motion as a matter of routine.
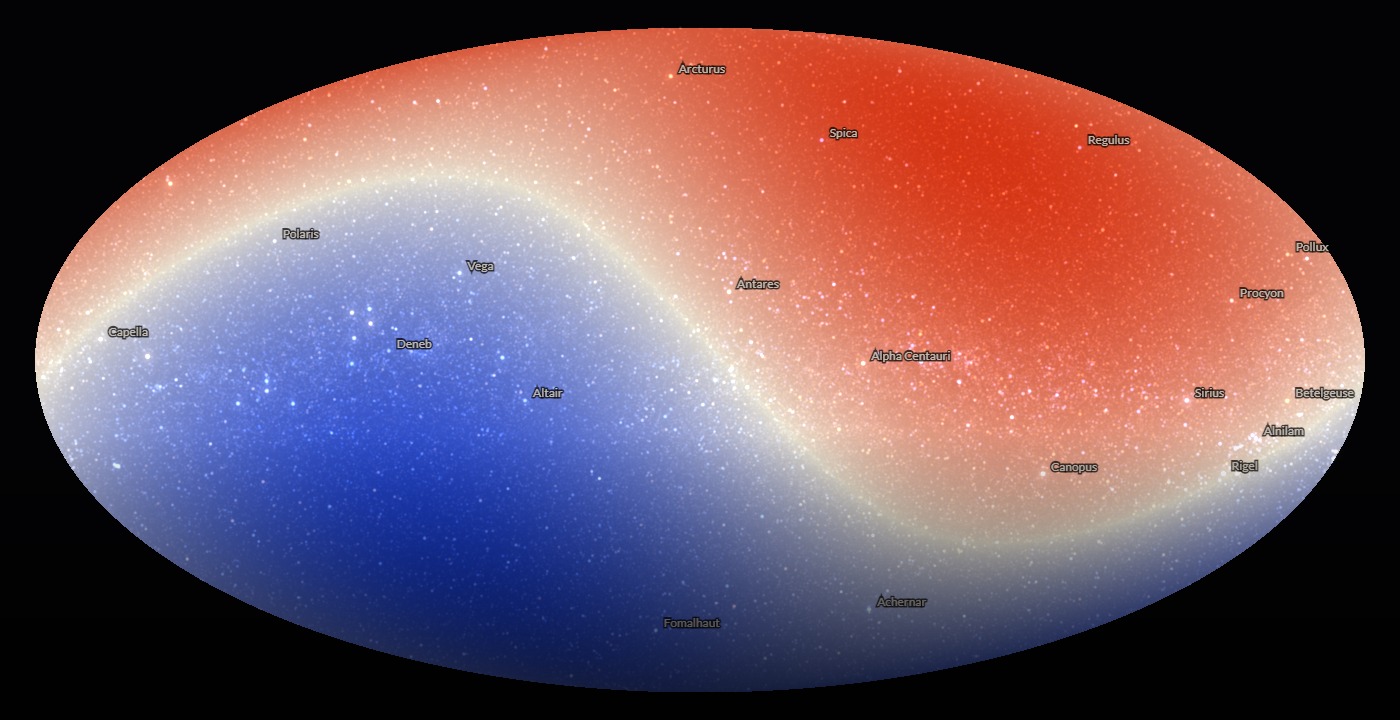
The Doppler shift of the Big Bang's afterglow tells us how fast we are moving through the universe. The Sun travels at 370 km/s toward the constellations Leo and Crater, so the afterglow is 0.0034 K warmer in that direction and the same amount colder in the opposite one. The COBE, WMAP and Planck satellites have mapped this "dipole" precisely: Planck measured 3.362 thousandths of a degree. The view below shows the simulator's calculation of it, in false colour like the published maps. In 2014 the Planck team also measured the afterglow's faint pattern of hot and cold spots being slightly crowded toward the direction we're heading, the same effect this page is about at our modest speed, consistent with the dipole. They called their paper "Eppur si muove" ("and yet it moves").
Controlled Experiments
Switch Off the Physics, One Effect at a Time
Each comparison below changes just one thing, so you can see what each piece of physics does. Every image was rendered by the simulator, and the settings for all of them are under Physics and Display in the panel.
Direction, colour, brightness, glow
The view ahead at 99% of light speed, built up one effect at a time. First only aberration, which moves each star but leaves its colour and brightness alone. Then the Doppler shift of each star's colour. Then the change in each star's brightness. Finally the light spread across the sky: the Milky Way's starlight and dust, the galaxies and the Big Bang's afterglow.
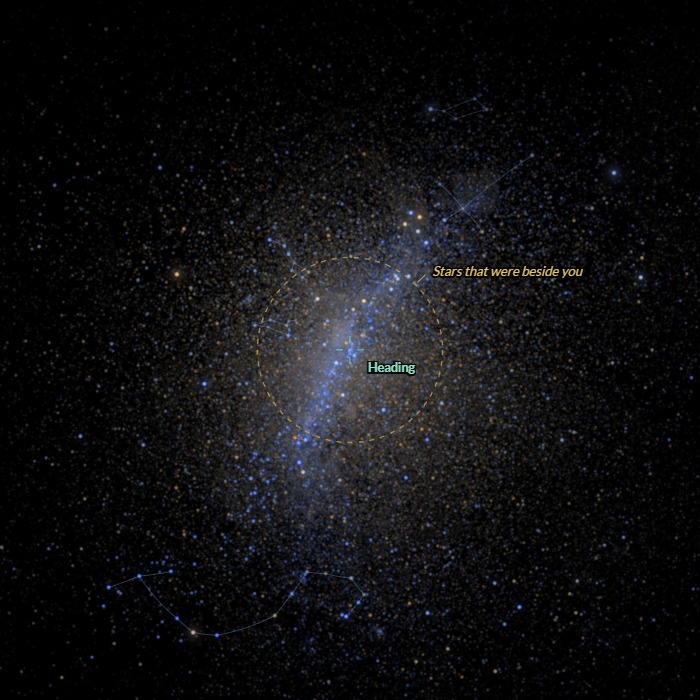 Aberration only
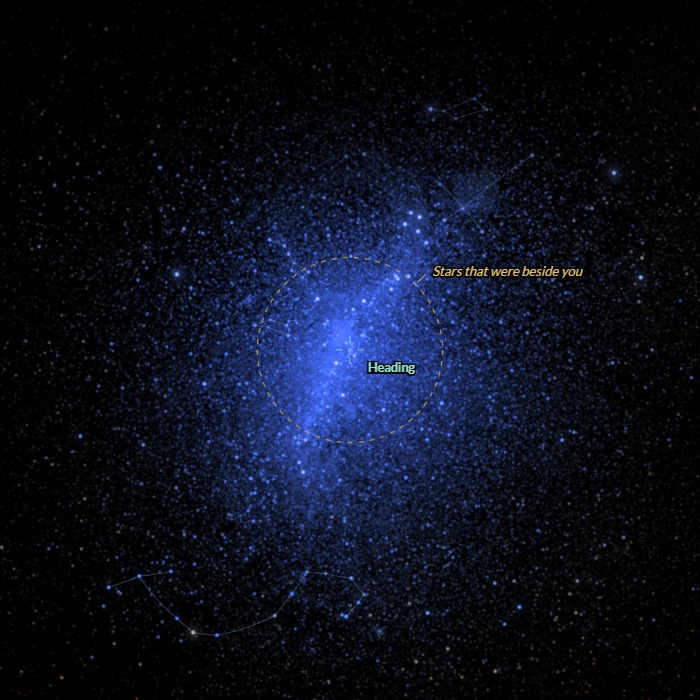 + colour shift
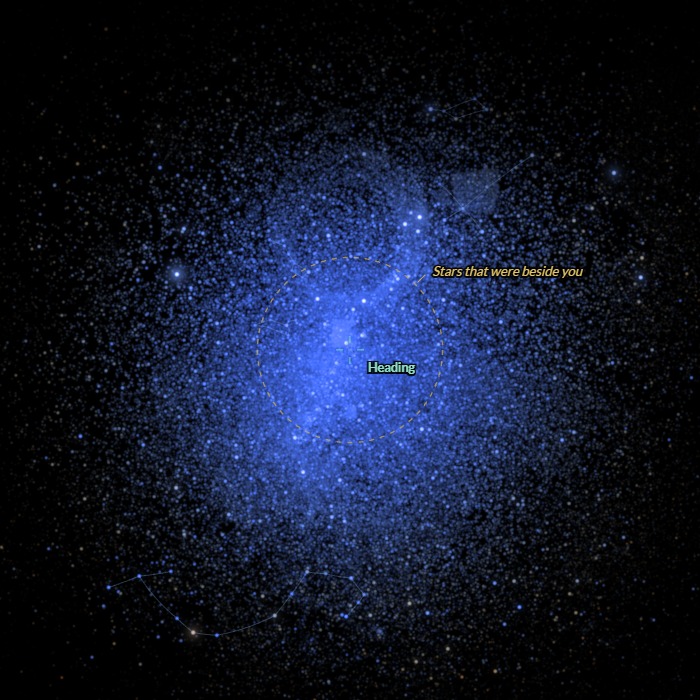 + brightness change
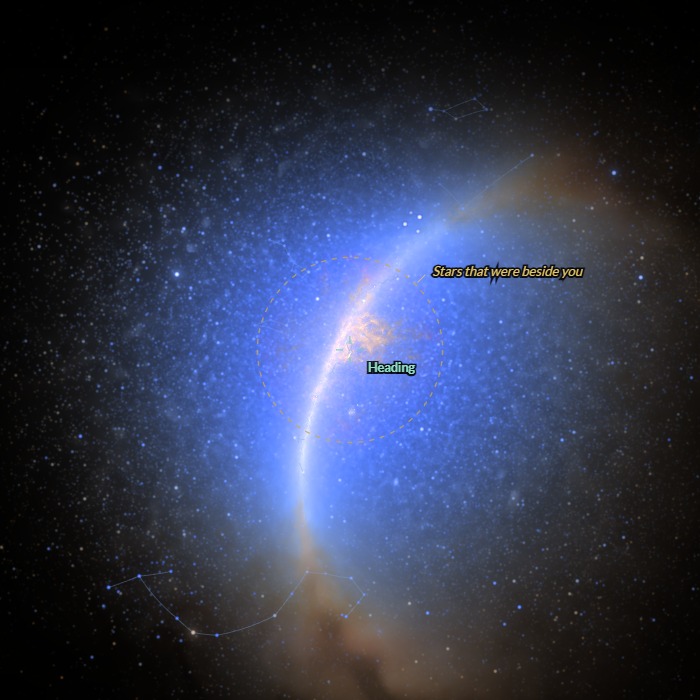 + the glow
Undo the crowding
Looking straight ahead through this kind of lens, aberration is exactly a zoom out, by the Doppler factor straight ahead. Zooming back in by the same factor undoes it: Orion at 99% of light speed comes back at its normal size and shape, with only its colours and brightness changed (the glow is switched off here so the stars can be compared).
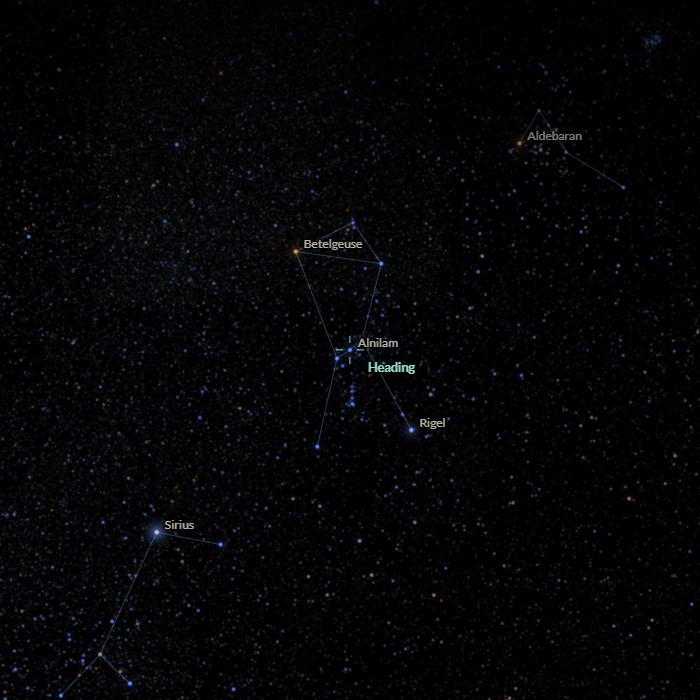 Standing still
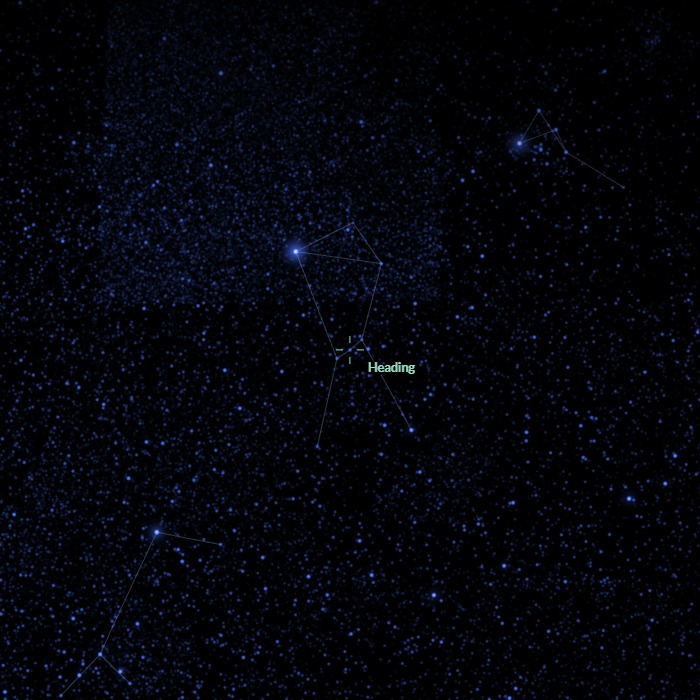 99%, zoomed in 14 times
Speed
The view ahead at rest, 50%, 90%, 99% and 99.9% of light speed, all through the same wide lens.
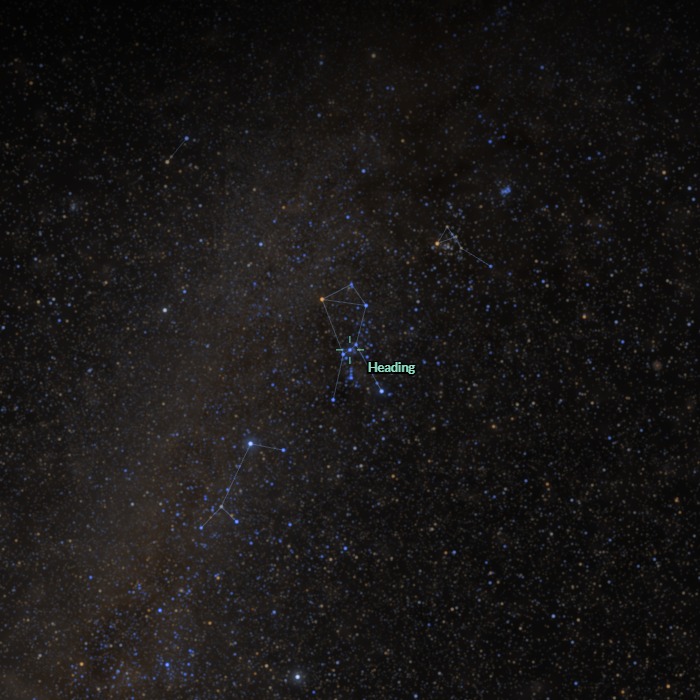 At rest
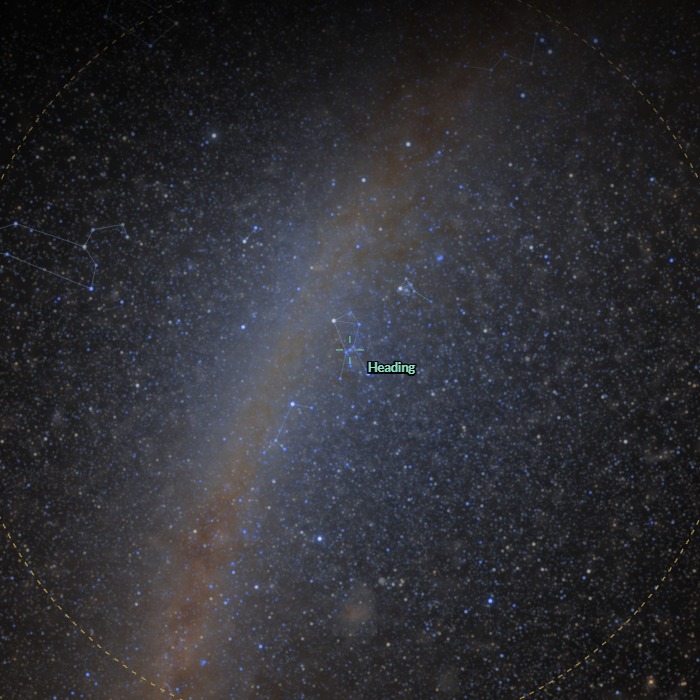 50%
50%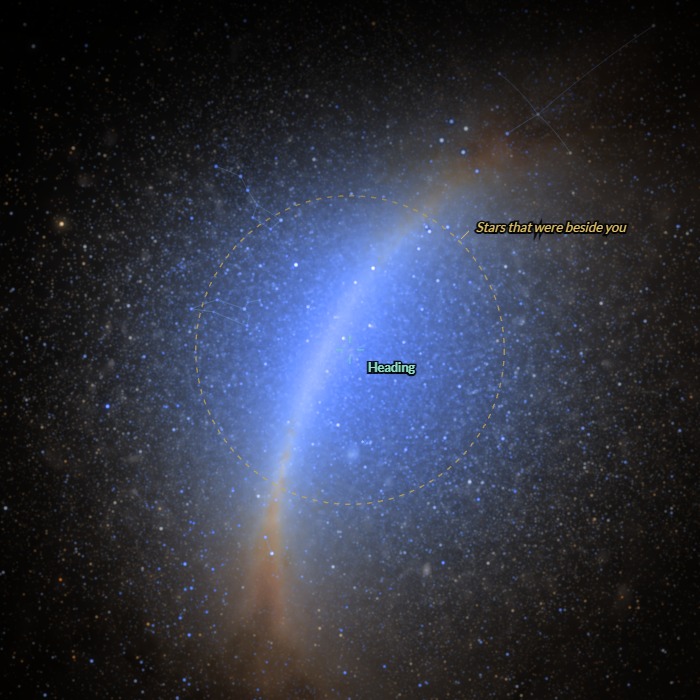 90%
90%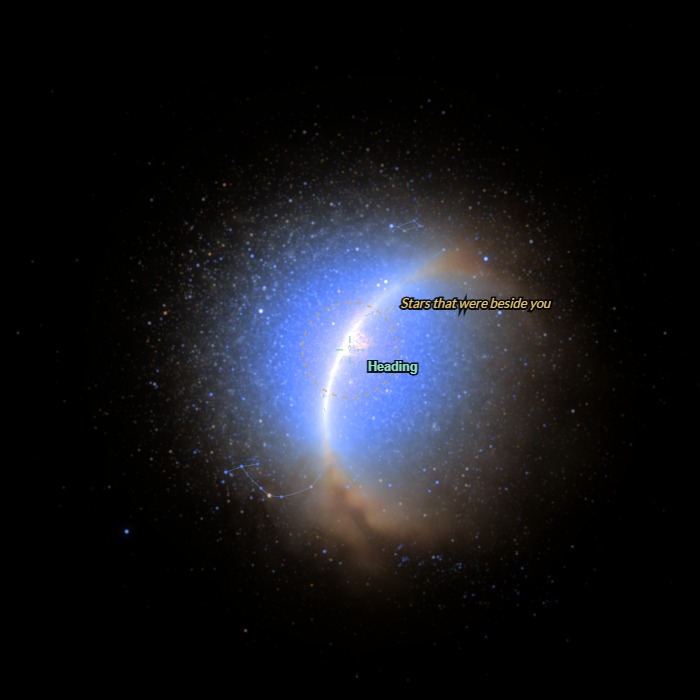 99%
99%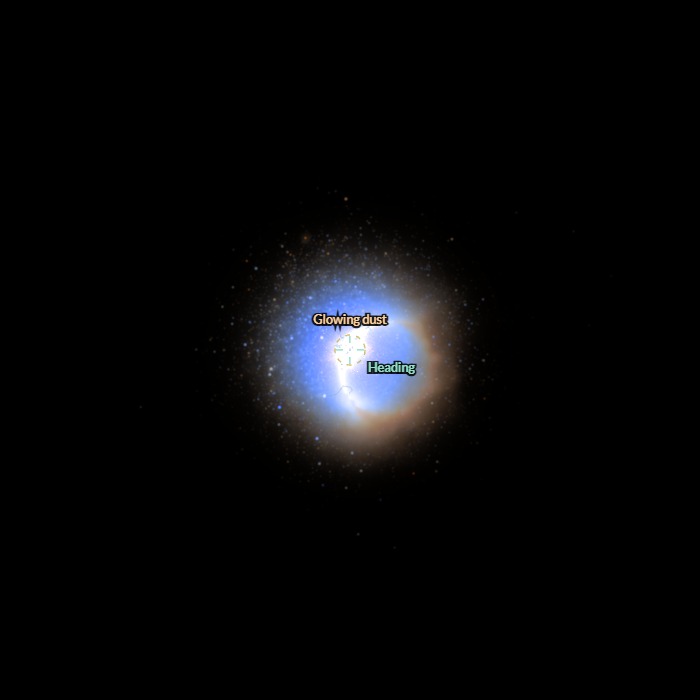 99.9%
99.9%The whole sky
Every direction at once on one disc: straight ahead at the centre, straight behind all around the rim, and the inner dotted circle 90° from the heading. As the speed rises, the whole sky gathers toward the centre and the rim goes dark.
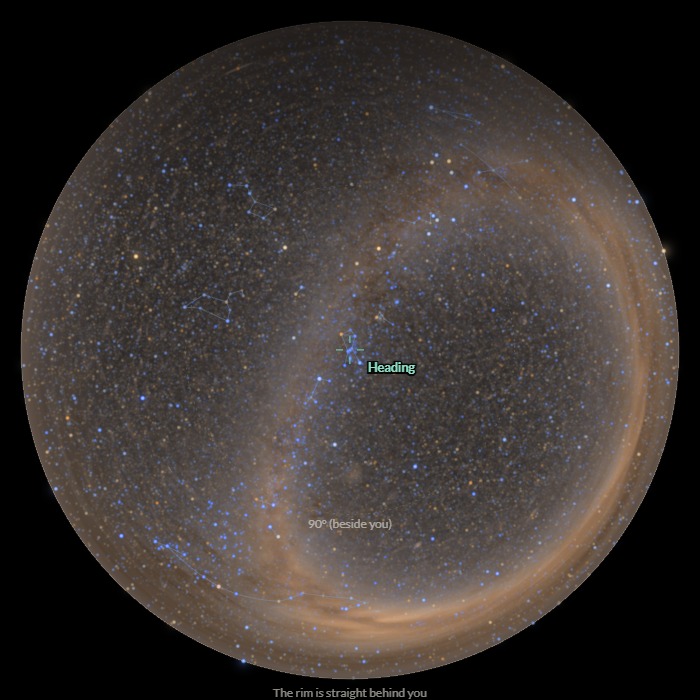 At rest
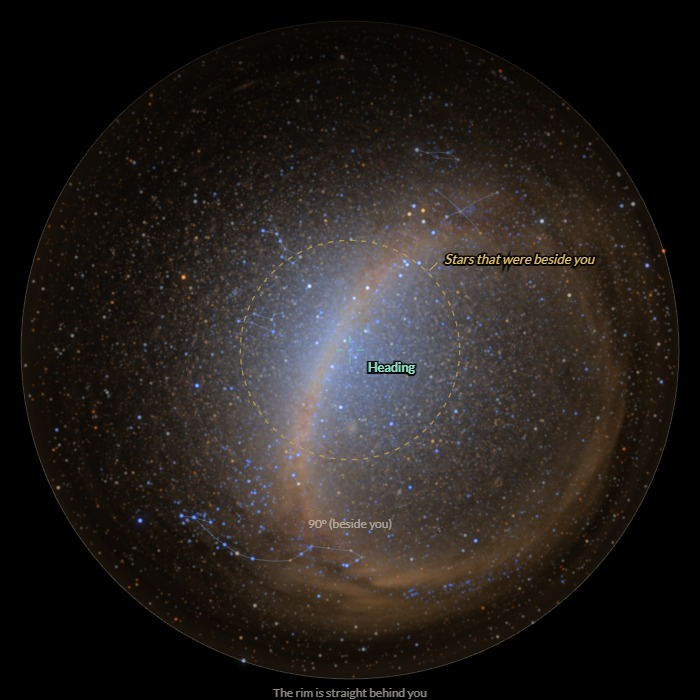 50%
50%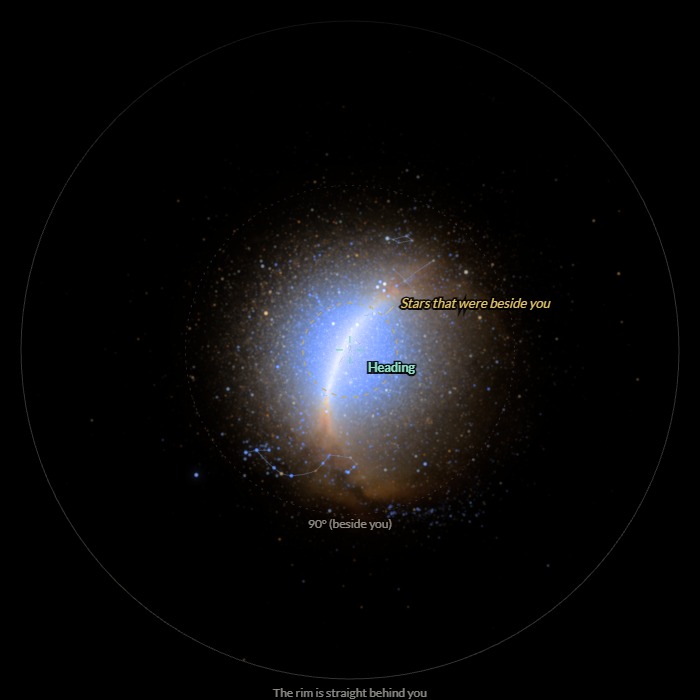 90%
90%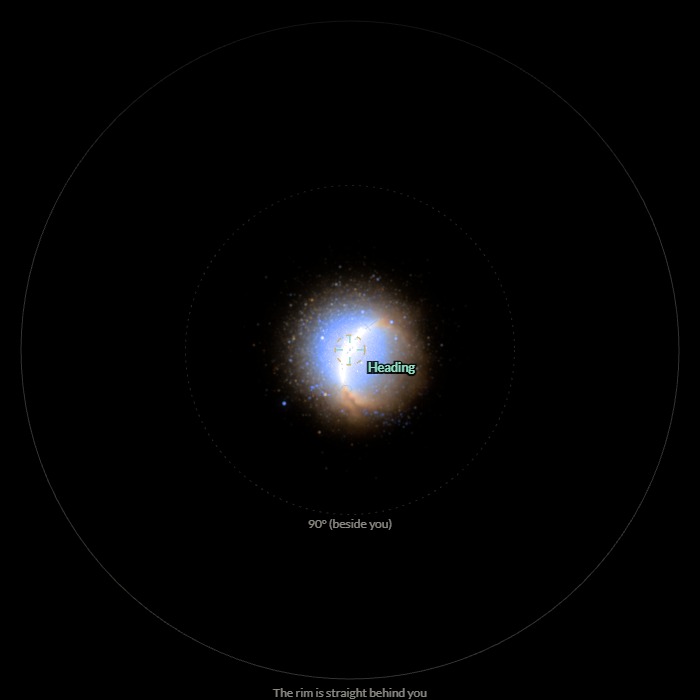 99%
99%Looking back
The view behind the ship at rest, 50% and 75% of light speed. The stars slide away from the point the ship came from, toward the edges of the view, and turn orange and red as they fade; by 90% the view behind is almost completely dark.
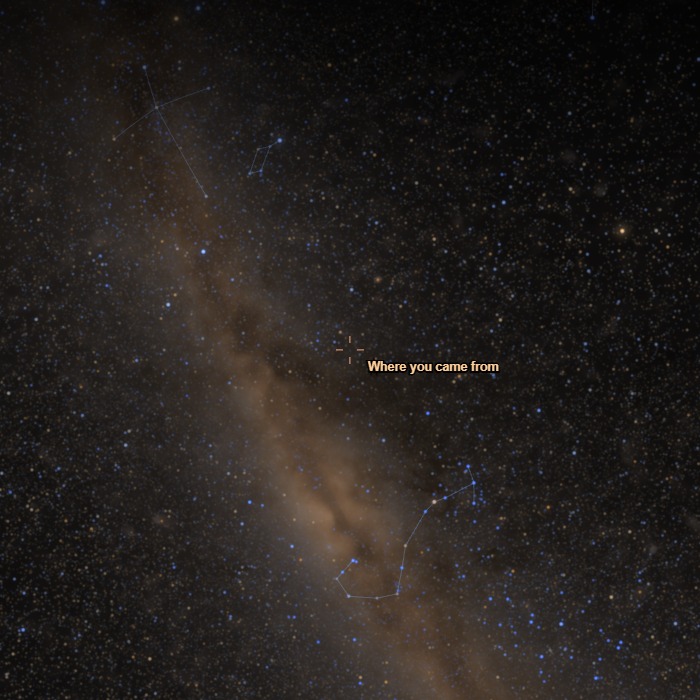 At rest
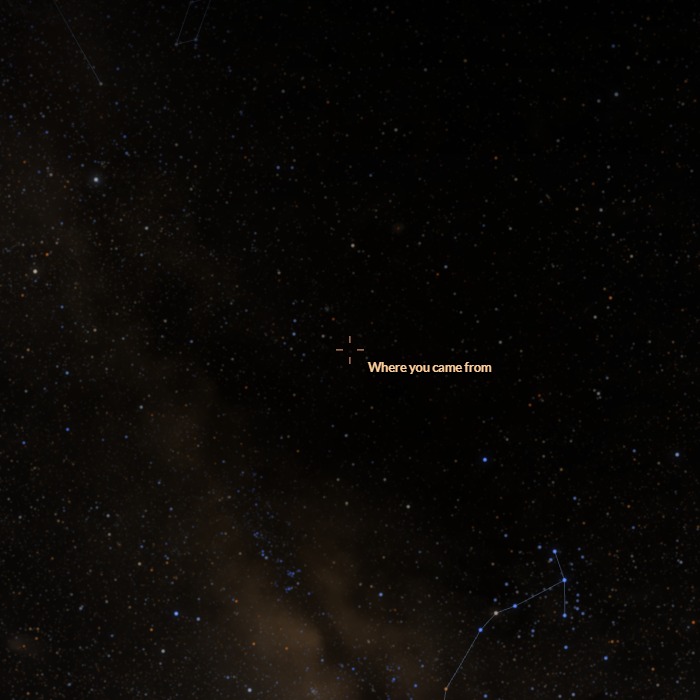 50%
50%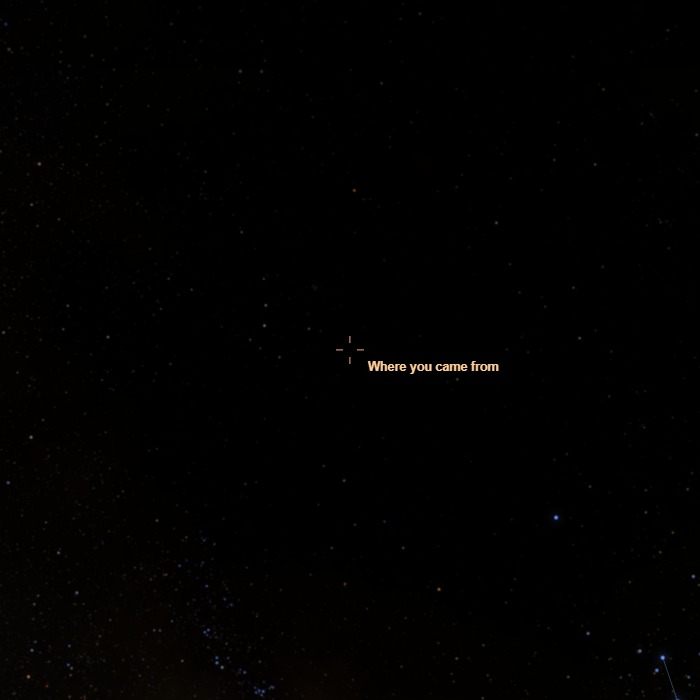 75%
75%A Trip to the Nearest Star
Journey to Alpha Centauri
The "Journey to Alpha Centauri" view flies a ship to our nearest neighbouring star system, 4.4 light-years away, at a constant 1 g: it accelerates as hard as gravity pulls on Earth, so the crew feel their normal weight, for the first half of the trip, then turns round and slows down at 1 g for the second half. It reaches 95% of light speed at the halfway point. By the ship's clock the trip takes 3.6 years; on Earth, 6 years pass. Along the way every star with a measured distance is placed in three dimensions, so the nearby ones shift against the background as you pass them.
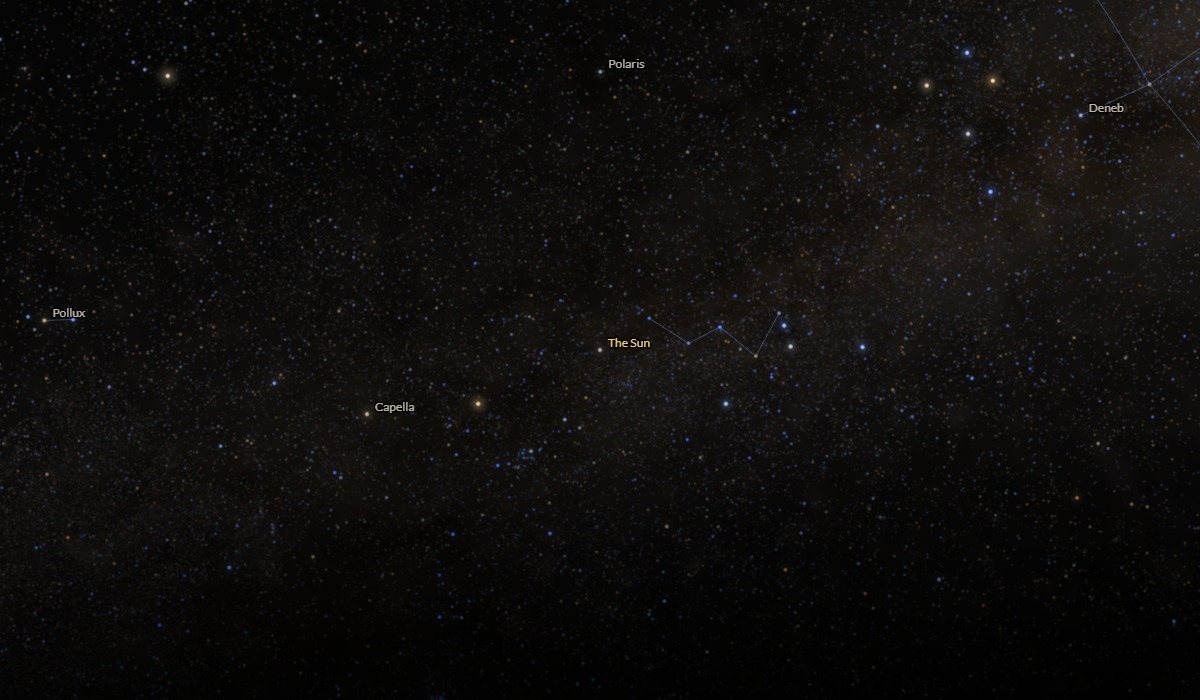
At the end the ship turns round. The Sun is now just another bright star, of magnitude 0.5, and it sits in Cassiopeia, adding a sixth star to the familiar W.
Limits
What This Model Leaves Out
- Stars as glowing bodies. Each star's spectrum is taken as that of a hot glowing body at its temperature (a blackbody). Real stars differ. Behind the ship, the light you see started out as ultraviolet, where real stars are fainter than a blackbody, so behind is probably even darker than shown. Ahead, the light started out as infrared, where cool stars are brighter than a blackbody (Betelgeuse by more than a magnitude, and more again from the dust around it), so red stars brighten even more than shown.
- A century-old catalogue. The stars come from the Henry Draper Catalogue, compiled at Harvard between 1918 and 1936 and free for anyone to use. It lists stars down to about magnitude 9, with positions good to about an arcminute (they are from 1900, and the stars have moved a little since), brightnesses good to a few tenths of a magnitude, and spectral classes from which the temperatures are estimated. The brightest and nearest stars use modern measurements. Fainter stars that would brighten into view near light speed are missing as points, though their light is included in the Milky Way's glow, so the counts of visible stars ahead are on the low side.
- The Milky Way's glow. Its brightness is measured, in the near infrared, at a resolution of 0.7°; its spectrum and the way dust dims it in visible light come from a standard model. The dust's glow uses the measured spectrum of dust far from the plane of the Milky Way, known only in broad bands and smoothed between them, scaled everywhere by an all-sky dust map. The real spectrum has strong bands from carbon molecules between 6 and 13 µm, which this smoothed version underrepresents, and the dust around Orion is warmer than average. So toward Orion the glow from 98% to 99.5% of light speed could be several times brighter than shown, and somewhat brighter at higher speeds too: the figures for the glow are best read as lower limits. The ultraviolet part of the Milky Way's starlight is left out, which only matters behind the ship.
- Things that aren't there. The Sun's zodiacal dust (the ship is assumed to be beyond it), nearby galaxies such as Andromeda as separate objects, and the hot and cold spots in the Big Bang's afterglow (1 part in 100,000) are not included. The stars are fixed; their own motions are far too slow to matter on these timescales.
- An ideal camera. The pictures are what an ideal camera would record in an instant. Within a picture, all light is shown with one exposure, set so that stars down to the chosen magnitude are just visible at that zoom. A narrower view is therefore exposed darker for the glow, and the whole-sky and map views, where each pixel covers more sky, brighter, as with a longer exposure. Faint light is shown in colour, as a camera records it; the eye sees faint light in grey. The glare around bright stars is the only cosmetic step and can be switched off.
- A dangerous trip. At these speeds, the thin gas between the stars would hit the ship as a storm of high-energy radiation, and a speck of dust would strike with the energy of a bomb. The simulator shows only what the passengers would see.
- Speeding up. Each frame shows the view from a ship moving steadily at that moment's speed. For directions and colours this is exact even while the ship accelerates: what you see at an instant depends only on your velocity at that instant.
Method
How It's Calculated and Checked
For every star, every frame, your graphics card takes the direction of its light in the stars' frame and turns it into the direction seen from the ship, using the exact formula for the aberration of light, tan(θ′/2) = e−η tan(θ/2), where η is the ship's rapidity. The same calculation gives the Doppler factor, which shifts the star's temperature, and the star's brightness follows from how its shifted spectrum looks to the eye and from its light being concentrated into a smaller patch of sky. The glow is calculated for every pixel by following its direction back to the stars' frame, looking up the measured brightness there, and shifting the measured spectrum in the same way.
A separate Python program, written independently, checks the result. It works the same physics out a different way, by transforming the light's energy and momentum with explicit Lorentz transformations in 50-digit arithmetic, and the two agree to 10−12. The light the graphics card draws, read back and added up, matches the total the physics predicts to within 0.4% (3% where stars sit at the edge of the picture), and the stars land within about a pixel of where the independent program puts them. The method page has the equations, the data sets, all the tests and the references.
Use These Images
Free to Use, With Credit
Images and recordings you make with this simulator, and the figures on this page, may be used for any purpose, including teaching, publication and commercial work, without asking permission. We only ask that you credit Frosty Wren Studios, for example:
Starflight simulation: Frosty Wren Studios, frostywren.com/light-speed-flight"Save image" adds this line to the corner of each picture by default; you can switch it off under Playback and output. The simulator's source code is not covered by this permission. The sky is built from public data: the Henry Draper Catalogue (Harvard College Observatory, 1918–1936; machine-readable edition by NASA's Astronomical Data Center), the COBE/DIRBE maps (NASA) and the dust map of Schlegel, Finkbeiner & Davis (via NASA's LAMBDA archive). All of these are public domain or free of restrictions.